
Big data
Leif Larsen Henning Larsen
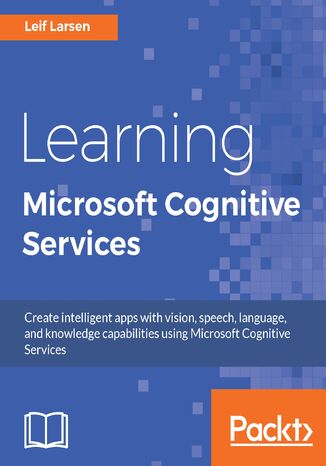
Take your app development to the next level with Learning Microsoft Cognitive Services. Using Leif's knowledge of each of the powerful APIs, you'll learn how to create smarter apps with more human-like capabilities. ? Discover what each API has to offer and learn how to add it to your app ? Study each AI using theory and practical examples ? Learn current API best practices
Leif Larsen Henning Larsen
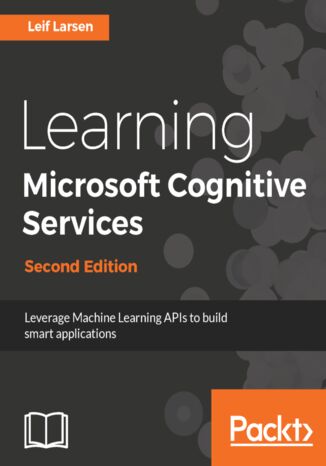
Microsoft has revamped its Project Oxford to launch the all new Cognitive Services platform-a set of 30 APIs to add speech, vision, language, and knowledge capabilities to apps.This book will introduce you to 24 of the APIs released as part of Cognitive Services platform and show you how to leverage their capabilities. More importantly, you'll see how the power of these APIs can be combined to build real-world apps that have cognitive capabilities. The book is split into three sections: computer vision, speech recognition and language processing, and knowledge and search.You will be taken through the vision APIs at first as this is very visual, and not too complex. The next part revolves around speech and language, which are somewhat connected. The last part is about adding real-world intelligence to apps by connecting them to Knowledge and Search APIs.By the end of this book, you will be in a position to understand what Microsoft Cognitive Service can offer and how to use the different APIs.
Leif Larsen
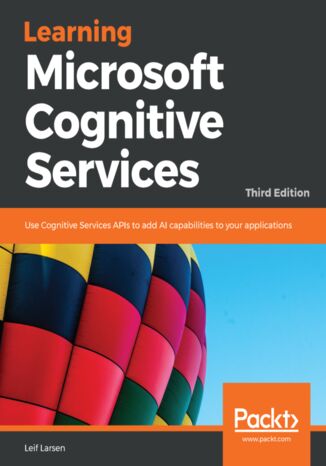
Microsoft Cognitive Services is a set of APIs for integrating artificial intelligence in your applications to solve logical business problems. If you’re new to developing applications with AI, Learning Microsoft Cognitive Services will give you a comprehensive introduction to Microsoft’s AI stack and get you up-to-speed in no time.The book introduces you to 24 APIs, including Emotion, Language, Vision, Speech, Knowledge, and Search. Using Visual Studio, you can develop applications with enhanced capabilities for image processing, speech recognition, text processing, and much more. Moving forward, you will work with datasets that enable your applications to process various data in the form of image, video, or text.By the end of the book, you’ll be able to confidently explore Cognitive Services APIs for building intelligent applications that can be deployed for real-world business uses.
Jerome Baton, Rik Van Bruggen
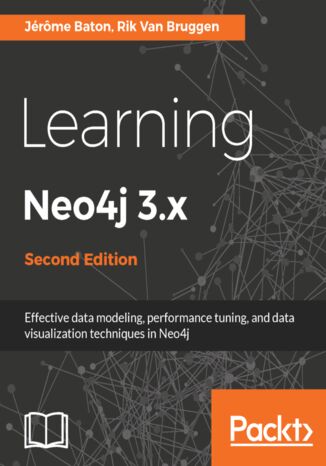
Neo4j is a graph database that allows traversing huge amounts of data with ease. This book aims at quickly getting you started with the popular graph database Neo4j.Starting with a brief introduction to graph theory, this book will show you the advantages of using graph databases along with data modeling techniques for graph databases. You'll gain practical hands-on experience with commonly used and lesser known features for updating graph store with Neo4j's Cypher query language. Furthermore, you'll also learn to create awesome procedures using APOC and extend Neo4j's functionality, enabling integration, algorithmic analysis, and other advanced spatial operation capabilities on data.Through the course of the book you will come across implementation examples on the latest updates in Neo4j, such as in-graph indexes, scaling, performance improvements, visualization, data refactoring techniques, security enhancements, and much more. By the end of the book, you'll have gained the skills to design and implement modern spatial applications, from graphing data to unraveling business capabilities with the help of real-world use cases.
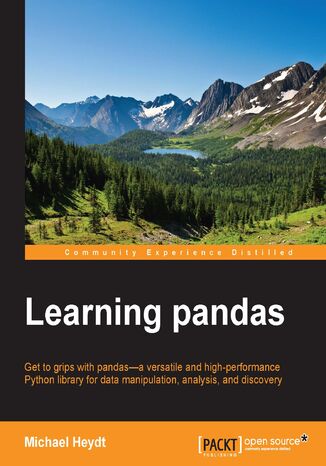
Michael Heydt
If you are a Python programmer who wants to get started with performing data analysis using pandas and Python, this is the book for you. Some experience with statistical analysis would be helpful but is not mandatory.
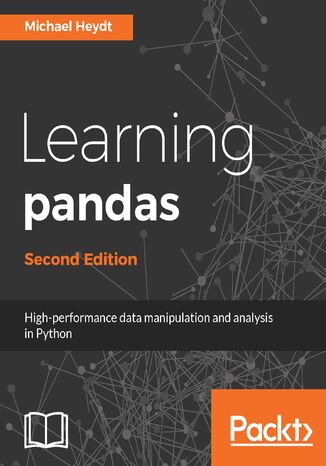
Learning pandas. High performance data manipulation and analysis using Python - Second Edition
Nicola Rainiero, Sonali Dayal, Michael Heydt
You will learn how to use pandas to perform data analysis in Python. You will start with an overview of data analysis and iteratively progress from modeling data, to accessing data from remote sources, performing numeric and statistical analysis, through indexing and performing aggregate analysis, and finally to visualizing statistical data and applying pandas to finance.With the knowledge you gain from this book, you will quickly learn pandas and how it can empower you in the exciting world of data manipulation, analysis and science.
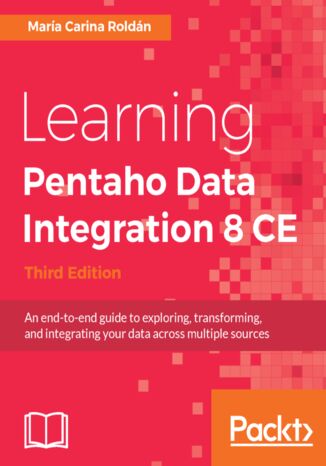
Dan Keeley, Diethard Steiner, María Carina Roldán,...
Pentaho Data Integration(PDI) is an intuitive and graphical environment packed with drag-and-drop design and powerful Extract-Tranform-Load (ETL) capabilities. This book shows and explains the new interactive features of Spoon, the revamped look and feel, and the newest features of the tool including transformations and jobs Executors and the invaluable Metadata Injection capability.We begin with the installation of PDI software and then move on to cover all the key PDI concepts. Each of the chapter introduces new features, enabling you to gradually get practicing with the tool. First, you will learn to do all kind of data manipulation and work with simple plain files. Then, the book teaches you how you can work with relational databases inside PDI. Moreover, you will be given a primer on data warehouse concepts and you will learn how to load data in a data warehouse. During the course of this book, you will be familiarized with its intuitive, graphical and drag-and-drop design environment.By the end of this book, you will learn everything you need to know in order to meet your data manipulation requirements. Besides, your will be given best practices and advises for designing and deploying your projects.
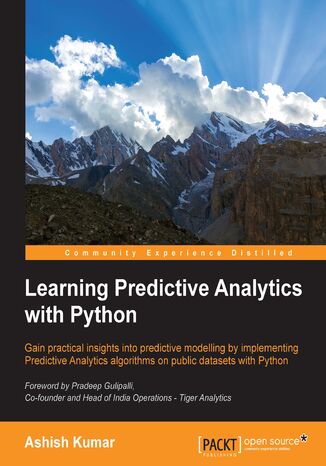
Ashish Kumar
Social Media and the Internet of Things have resulted in an avalanche of data. Data is powerful but not in its raw form - It needs to be processed and modeled, and Python is one of the most robust tools out there to do so. It has an array of packages for predictive modeling and a suite of IDEs to choose from. Learning to predict who would win, lose, buy, lie, or die with Python is an indispensable skill set to have in this data age. This book is your guide to getting started with Predictive Analytics using Python. You will see how to process data and make predictive models from it. We balance both statistical and mathematical concepts, and implement them in Python using libraries such as pandas, scikit-learn, and numpy. You’ll start by getting an understanding of the basics of predictive modeling, then you will see how to cleanse your data of impurities and get it ready it for predictive modeling. You will also learn more about the best predictive modeling algorithms such as Linear Regression, Decision Trees, and Logistic Regression. Finally, you will see the best practices in predictive modeling, as well as the different applications of predictive modeling in the modern world.