Kategorie
Ebooki
-
Biznes i ekonomia
- Bitcoin
- Bizneswoman
- Coaching
- Controlling
- E-biznes
- Ekonomia
- Finanse
- Giełda i inwestycje
- Kompetencje osobiste
- Komputer w biurze
- Komunikacja i negocjacje
- Mała firma
- Marketing
- Motywacja
- Multimedialne szkolenia
- Nieruchomości
- Perswazja i NLP
- Podatki
- Polityka społeczna
- Poradniki
- Prezentacje
- Przywództwo
- Public Relation
- Raporty, analizy
- Sekret
- Social Media
- Sprzedaż
- Start-up
- Twoja kariera
- Zarządzanie
- Zarządzanie projektami
- Zasoby ludzkie (HR)
-
Dla dzieci
-
Dla młodzieży
-
Edukacja
-
Encyklopedie, słowniki
-
E-prasa
- Architektura i wnętrza
- BHP
- Biznes i Ekonomia
- Dom i ogród
- E-Biznes
- Ekonomia i finanse
- Ezoteryka
- Finanse
- Finanse osobiste
- Firma
- Fotografia
- Informatyka
- Kadry i płace
- Kobieca
- Komputery, Excel
- Księgowość
- Kultura i literatura
- Naukowe i akademickie
- Ochrona środowiska
- Opiniotwórcze
- Oświata
- Podatki
- Podróże
- Psychologia
- Religia
- Rolnictwo
- Rynek książki i prasy
- Transport i Spedycja
- Zdrowie i uroda
-
Historia
-
Informatyka
- Aplikacje biurowe
- Bazy danych
- Bioinformatyka
- Biznes IT
- CAD/CAM
- Digital Lifestyle
- DTP
- Elektronika
- Fotografia cyfrowa
- Grafika komputerowa
- Gry
- Hacking
- Hardware
- IT w ekonomii
- Pakiety naukowe
- Podręczniki szkolne
- Podstawy komputera
- Programowanie
- Programowanie mobilne
- Serwery internetowe
- Sieci komputerowe
- Start-up
- Systemy operacyjne
- Sztuczna inteligencja
- Technologia dla dzieci
- Webmasterstwo
-
Inne
-
Języki obce
-
Kultura i sztuka
-
Lektury szkolne
-
Literatura
- Antologie
- Ballada
- Biografie i autobiografie
- Dla dorosłych
- Dramat
- Dzienniki, pamiętniki, listy
- Epos, epopeja
- Esej
- Fantastyka i science-fiction
- Felietony
- Fikcja
- Humor, satyra
- Inne
- Klasyczna
- Kryminał
- Literatura faktu
- Literatura piękna
- Mity i legendy
- Nobliści
- Nowele
- Obyczajowa
- Okultyzm i magia
- Opowiadania
- Pamiętniki
- Podróże
- Poemat
- Poezja
- Polityka
- Popularnonaukowa
- Powieść
- Powieść historyczna
- Proza
- Przygodowa
- Publicystyka
- Reportaż
- Romans i literatura obyczajowa
- Sensacja
- Thriller, Horror
- Wywiady i wspomnienia
-
Nauki przyrodnicze
-
Nauki społeczne
-
Podręczniki szkolne
-
Popularnonaukowe i akademickie
- Archeologia
- Bibliotekoznawstwo
- Filmoznawstwo
- Filologia
- Filologia polska
- Filozofia
- Finanse i bankowość
- Geografia
- Gospodarka
- Handel. Gospodarka światowa
- Historia i archeologia
- Historia sztuki i architektury
- Kulturoznawstwo
- Lingwistyka
- Literaturoznawstwo
- Logistyka
- Matematyka
- Medycyna
- Nauki humanistyczne
- Pedagogika
- Pomoce naukowe
- Popularnonaukowa
- Pozostałe
- Psychologia
- Socjologia
- Teatrologia
- Teologia
- Teorie i nauki ekonomiczne
- Transport i spedycja
- Wychowanie fizyczne
- Zarządzanie i marketing
-
Poradniki
-
Poradniki do gier
-
Poradniki zawodowe i specjalistyczne
-
Prawo
- BHP
- Historia
- Kodeks drogowy. Prawo jazdy
- Nauki prawne
- Ochrona zdrowia
- Ogólne, kompendium wiedzy
- Podręczniki akademickie
- Pozostałe
- Prawo budowlane i lokalowe
- Prawo cywilne
- Prawo finansowe
- Prawo gospodarcze
- Prawo gospodarcze i handlowe
- Prawo karne
- Prawo karne. Przestępstwa karne. Kryminologia
- Prawo międzynarodowe
- Prawo międzynarodowe i zagraniczne
- Prawo ochrony zdrowia
- Prawo oświatowe
- Prawo podatkowe
- Prawo pracy i ubezpieczeń społecznych
- Prawo publiczne, konstytucyjne i administracyjne
- Prawo rodzinne i opiekuńcze
- Prawo rolne
- Prawo socjalne, prawo pracy
- Prawo Unii Europejskiej
- Przemysł
- Rolne i ochrona środowiska
- Słowniki i encyklopedie
- Zamówienia publiczne
- Zarządzanie
-
Przewodniki i podróże
- Afryka
- Albumy
- Ameryka Południowa
- Ameryka Środkowa i Północna
- Australia, Nowa Zelandia, Oceania
- Austria
- Azja
- Bałkany
- Bliski Wschód
- Bułgaria
- Chiny
- Chorwacja
- Czechy
- Dania
- Egipt
- Estonia
- Europa
- Francja
- Góry
- Grecja
- Hiszpania
- Holandia
- Islandia
- Litwa
- Łotwa
- Mapy, Plany miast, Atlasy
- Miniprzewodniki
- Niemcy
- Norwegia
- Podróże aktywne
- Polska
- Portugalia
- Pozostałe
- Przewodniki po hotelach i restauracjach
- Rosja
- Rumunia
- Słowacja
- Słowenia
- Szwajcaria
- Szwecja
- Świat
- Turcja
- Ukraina
- Węgry
- Wielka Brytania
- Włochy
-
Psychologia
- Filozofie życiowe
- Kompetencje psychospołeczne
- Komunikacja międzyludzka
- Mindfulness
- Ogólne
- Perswazja i NLP
- Psychologia akademicka
- Psychologia duszy i umysłu
- Psychologia pracy
- Relacje i związki
- Rodzicielstwo i psychologia dziecka
- Rozwiązywanie problemów
- Rozwój intelektualny
- Sekret
- Seksualność
- Uwodzenie
- Wygląd i wizerunek
- Życiowe filozofie
-
Religia
-
Sport, fitness, diety
-
Technika i mechanika
Audiobooki
-
Biznes i ekonomia
- Bitcoin
- Bizneswoman
- Coaching
- Controlling
- E-biznes
- Ekonomia
- Finanse
- Giełda i inwestycje
- Kompetencje osobiste
- Komunikacja i negocjacje
- Mała firma
- Marketing
- Motywacja
- Nieruchomości
- Perswazja i NLP
- Podatki
- Polityka społeczna
- Poradniki
- Prezentacje
- Przywództwo
- Public Relation
- Sekret
- Social Media
- Sprzedaż
- Start-up
- Twoja kariera
- Zarządzanie
- Zarządzanie projektami
- Zasoby ludzkie (HR)
-
Dla dzieci
-
Dla młodzieży
-
Edukacja
-
Encyklopedie, słowniki
-
E-prasa
-
Historia
-
Informatyka
-
Inne
-
Języki obce
-
Kultura i sztuka
-
Lektury szkolne
-
Literatura
- Antologie
- Ballada
- Biografie i autobiografie
- Dla dorosłych
- Dramat
- Dzienniki, pamiętniki, listy
- Epos, epopeja
- Esej
- Fantastyka i science-fiction
- Felietony
- Fikcja
- Humor, satyra
- Inne
- Klasyczna
- Kryminał
- Literatura faktu
- Literatura piękna
- Mity i legendy
- Nobliści
- Nowele
- Obyczajowa
- Okultyzm i magia
- Opowiadania
- Pamiętniki
- Podróże
- Poezja
- Polityka
- Popularnonaukowa
- Powieść
- Powieść historyczna
- Proza
- Przygodowa
- Publicystyka
- Reportaż
- Romans i literatura obyczajowa
- Sensacja
- Thriller, Horror
- Wywiady i wspomnienia
-
Nauki przyrodnicze
-
Nauki społeczne
-
Popularnonaukowe i akademickie
-
Poradniki
-
Poradniki zawodowe i specjalistyczne
-
Prawo
-
Przewodniki i podróże
-
Psychologia
- Filozofie życiowe
- Komunikacja międzyludzka
- Mindfulness
- Ogólne
- Perswazja i NLP
- Psychologia akademicka
- Psychologia duszy i umysłu
- Psychologia pracy
- Relacje i związki
- Rodzicielstwo i psychologia dziecka
- Rozwiązywanie problemów
- Rozwój intelektualny
- Sekret
- Seksualność
- Uwodzenie
- Wygląd i wizerunek
- Życiowe filozofie
-
Religia
-
Sport, fitness, diety
-
Technika i mechanika
Kursy video
-
Bazy danych
-
Big Data
-
Biznes, ekonomia i marketing
-
Cyberbezpieczeństwo
-
Data Science
-
DevOps
-
Dla dzieci
-
Elektronika
-
Grafika/Wideo/CAX
-
Gry
-
Microsoft Office
-
Narzędzia programistyczne
-
Programowanie
-
Rozwój osobisty
-
Sieci komputerowe
-
Systemy operacyjne
-
Testowanie oprogramowania
-
Urządzenia mobilne
-
UX/UI
-
Web development
-
Zarządzanie
Podcasty
- Ebooki
- Informatyka
- Biznes IT
Biznes IT
Książki online z kategorii Biznes IT pomogą Ci opanować takie zagadnienia techniczne, jak analiza danych, blockchain, czy programowanie. Znajdziesz tutaj także świetne pozycje dotyczące reklamy internetowej i ogólnie tego, jak z powodzeniem prowadzić biznes online. Omawiają one choćby to, jak analizować dane marketingowe oraz budować dobrą relację z klientem.
The Polars Cookbook is a comprehensive, hands-on guide to Python Polars, one of the first resources dedicated to this powerful data processing library. Written by Yuki Kakegawa, a seasoned data analytics consultant who has worked with industry leaders like Microsoft and Stanford Health Care, this book offers targeted, real-world solutions to data processing, manipulation, and analysis challenges. The book also includes a foreword by Marco Gorelli, a core contributor to Polars, ensuring expert insights into Polars' applications. From installation to advanced data operations, you’ll be guided through data manipulation, advanced querying, and performance optimization techniques. You’ll learn to work with large datasets, conduct sophisticated transformations, leverage powerful features like chaining, and understand its caveats. This book also shows you how to integrate Polars with other Python libraries such as pandas, numpy, and PyArrow, and explore deployment strategies for both on-premises and cloud environments like AWS, BigQuery, GCS, Snowflake, and S3. With use cases spanning data engineering, time series analysis, statistical analysis, and machine learning, Polars Cookbook provides essential techniques for optimizing and securing your workflows. By the end of this book, you'll possess the skills to design scalable, efficient, and reliable data processing solutions with Polars.
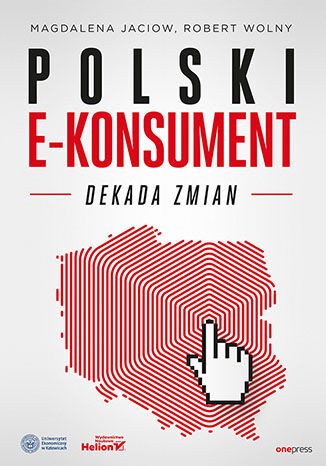
Polski e-konsument - typologia, zachowania
Robert Wolny, Magdalena Jaciow
E-commerce w Polsce ma bardzo duże perspektywy rozwoju. Wynika to przede wszystkim ze zmian przyzwyczajeń klientów, dla których zakupy w sieci przestały być "egzotyczną nowością", stając się jedną z opcji rozważanych przy zakupie niektórych produktów lub usług. Świadome budowanie relacji z klientem staje się priorytetem dla przedsiębiorstw działających w sieci. Podstawą budowy trwałych relacji z klientem jest znajomość potrzeb, preferencji, motywów zachowań i decyzji e-konsumenta. Wiedza na temat typów polskich e-konsumentów — ich cech i zachowań — ma istotne znaczenie dla przedsiębiorstw, które tworzą koncepcję strategii marketingowej oraz poszukują kierunków rozwoju swoich produktów i marek. W książce znajdziesz odpowiedzi na pytania: 1. KIM JEST e-konsument? Poznasz profil demograficzno-psychograficzny użytkowników internetu dokonujących zakupów w sieci. 2. CO KUPUJE e-konsument? Dowiesz się, jaka jest struktura asortymentowa koszyka zakupów. 3. DLACZEGO KUPUJE w internecie? Poznasz motywy dokonywania zakupów w sieci. 4. JAK KUPUJE? Dowiesz się, w jaki sposób i z jakich źródeł e-konsumenci gromadzą informacje o ofercie, co determinuje wybór produktu bądź usługi, jak płacą za produkt, jak zamawiają i odbierają kupiony produkt. 5. GDZIE KUPUJE? W sklepie internetowym czy na aukcji? Czym kieruje się, wybierając miejsce zakupu? Wyniki badań autorów pozwoliły stworzyć "fotografię" e-konsumenta oraz jego "koszyka zakupów". Jeśli jesteś przedstawicielem przedsiębiorstwa sprzedającego swoje produkty i usługi w internecie, książka ta dostarczy informacji, które pomogą Ci zorganizować sprzedaż, sformułować ofertę asortymentową, budować relacje z klientem. Partner wydania:
Polski e-konsument. Dekada zmian
Magdalena Jaciow, Robert Wolny
Kim dziś jest Polak kupujący w sieci? W 2010 roku nie wiedzieliśmy zbyt wiele o ludziach, którzy decydowali się robić zakupy w internecie. Wówczas ukazała się książka Polski e-konsument. Typologia, zachowania, która przez lata była najważniejszą lekturą i inspiracją dla praktyków i badaczy zachowań Polaków w sieci. Minęła dekada, a że w dzisiejszym cyfrowym świecie dziesięć lat to niemal wieczność, Magdalena Jaciow i Robert Wolny postanowili ponownie podjąć temat i przyjrzeć się temu, jak robimy zakupy online w 2020 roku. Z monografii Czytelnik dowie się między innymi: jak zdefiniować e-konsumenta, m-konsumenta i konsumenta cyfrowego jak zmienił się polski e-konsument dlaczego robi zakupy w sieci co najczęściej trafia do jego koszyka zakupów jak kupuje w sieci
Poradnik design thinking - czyli jak wykorzystać myślenie projektowe w biznesie
Beata Michalska-Dominiak, Piotr Grocholiński
Design thinking to metoda praktykowana z powodzeniem od dobrych kilkudziesięciu lat. Stosują ją światowi giganci, jak Apple czy Google. Definiowana jest jako podejście, sposób myślenia czy - jak kto woli - filozofia, w której proponowanie nowych rozwiązań zostaje poprzedzone gruntownym poznaniem i zrozumieniem potrzeb użytkowników. To metodologia absolutnie uniwersalna i intuicyjna, a dzięki filarom, na których bazuje - kulturze zrozumienia, dociekliwości i kwestionowaniu utartych schematów - pomaga nie tylko lepiej odpowiadać na ludzkie potrzeby. Pozwala także szybko odnajdować punkty zapalne, których zniwelowanie może znacząco przyczynić się do podniesienia jakości życia, pracy oraz doświadczeń zarówno pojedynczego człowieka, jak i społeczeństwa. Tym, co gwarantuje skuteczność metody design thinking, jest usystematyzowanie procesu, w którym technologiczną wykonalność projektu łączy się z jego biznesową opłacalnością i codzienną użytecznością. Proces ten składa się z pięciu podstawowych etapów: odkrywania, definiowania wyzwania (potrzeb), tworzenia rozwiązania, prototypowania, testowania, planowania wdrożenia. Wszystkie podejmowane działania prowokują do zadania sobie podstawowych w metodologii design thinking pytań: Dla kogo projektujemy? Po co to robimy? Co w związku z tym proponujemy? Jak to wygląda? Czy działa? Czy jest możliwe do wdrożenia? W efekcie kreowane są produkty i usługi pożądane przez odbiorców, przy tym praktyczne i piękne, a jednocześnie wolne od niepotrzebnych udziwnień. Ta książka pokazuje krok po kroku, jak posługiwać się metodą design thinking. Od poszukiwania pomysłów po pogłębionych wywiadach przeprowadzonych z klientami po przygotowanie rynkowego wdrożenia rozwiązania - szczegółowo omawia etapy procesu oraz praktyczne narzędzia, które z powodzeniem będziesz mógł wykorzystywać w swojej firmie. Znajdziesz tu studia przypadków z różnych branż oraz opinie i doświadczenia specjalistów, którzy stosują tę metodę w swoim biznesie. Beata Michalska-Dominiak i Piotr Grocholiński to założyciele społeczności Klientocentryczni skupiającej ekspertów metodyki design thinking i service design w Polsce. Ideą Klientocentrycznych jest wspieranie marki, tworzenie nowych produktów i usług, a także pomoc organizacjom w wewnętrznej transformacji. W myśl zasady, że liczą się ludzie, konsekwentnie zmieniają rzeczywistość firm, budując nową wartość i zapewniając zupełnie nowe doświadczenia zarówno klientom, jak i pracownikom. Więcej na www.klientocentryczni.pl.
PostgreSQL database servers have a common set of problems that they encounter as their usage gets heavier and requirements get more demanding. Peek into the future of your PostgreSQL 10 database's problems today. Know the warning signs to look for and how to avoid the most common issues before they even happen.Surprisingly, most PostgreSQL database applications evolve in the same way—choose the right hardware, tune the operating system and server memory use, optimize queries against the database and CPUs with the right indexes, and monitor every layer, from hardware to queries, using tools from inside and outside PostgreSQL. Also, using monitoring insight, PostgreSQL database applications continuously rework the design andconfiguration. On reaching the limits of a single server, they break things up; connection pooling, caching, partitioning, replication, and parallel queries can all help handle increasing database workloads.By the end of this book, you will have all the knowledge you need to design, run, and manage your PostgreSQL solution while ensuring high performance and high availability
PostgreSQL is a rock-solid, scalable, and safe enterprise-level relational database. With a broad range of features and stability, it is ever increasing in popularity.This book shows you how to take advantage of PostgreSQL 11 features for server-side programming. Server-side programming enables strong data encapsulation and coherence.The book begins with the importance of server-side programming and explains the risks of leaving all the checks outside the database. To build your capabilities further, you will learn how to write stored procedures, both functions and the new PostgreSQL 11 procedures, and create triggers to perform encapsulation and maintain data consistency.You will also learn how to produce extensions, the easiest way to package your programs for easy and solid deployment on different PostgreSQL installations.
PostgreSQL is one of the most powerful and easy to use database management systems. It has strong support from the community and is being actively developed with a new release every year. PostgreSQL supports the most advanced features included in SQL standards. It also provides NoSQL capabilities and very rich data types and extensions. All of this makes PostgreSQL a very attractive solution in software systems.If you run a database, you want it to perform well and you want to be able to secure it. As the world’s most advanced open source database, PostgreSQL has unique built-in ways to achieve these goals. This book will show you a multitude of ways to enhance your database’s performance and give you insights into measuring and optimizing a PostgreSQL database to achieve better performance. This book is your one-stop guide to elevate your PostgreSQL knowledge to the next level. First, you’ll get familiarized with essential developer/administrator concepts such as load balancing, connection pooling, and distributing connections to multiple nodes. Next, you will explore memory optimization techniques before exploring the security controls offered by PostgreSQL. Then, you will move on to the essential database/server monitoring and replication strategies with PostgreSQL. Finally, you will learn about query processing algorithms.
Potoki danych. Leksykon kieszonkowy. Przenoszenie i przetwarzanie danych na potrzeby ich analizy
Poprawnie zaprojektowane i wdrożone potoki danych mają kluczowe znaczenie dla pomyślnej analizy danych, a także w trakcie uczenia maszynowego. Pozyskanie ogromnych ilości danych z różnych źródeł najczęściej nie stanowi problemu. Nieco trudniejsze jest zaprojektowanie procesu ich przetwarzania w celu dostarczenia kontekstu w taki sposób, aby efektywnie korzystać z posiadanych danych w codziennej pracy organizacji i podejmować dzięki nim rozsądne decyzje. Oto zwięzły przewodnik przeznaczony dla inżynierów danych, którzy chcą poznać zasady implementacji potoków danych. Wyjaśnia najważniejsze pojęcia związane z potokami danych, opisuje zasady ich tworzenia i implementacji, prezentuje także najlepsze praktyki stosowane przez liderów w branży analizy danych. Dzięki książce zrozumiesz, w jaki sposób potoki danych działają na nowoczesnym stosie danych, poznasz też typowe zagadnienia, które trzeba przemyśleć przed podjęciem decyzji dotyczących implementacji. Dowiesz się, jakie są zalety samodzielnego opracowania rozwiązania, a jakie - zakupu gotowego produktu. Poznasz również podstawowe koncepcje, które mają zastosowanie dla frameworków typu open source, produktów komercyjnych i samodzielnie opracowywanych rozwiązań. Dowiedz się: czym jest potok danych i na czym polega jego działanie jak się odbywa przenoszenie i przetwarzanie danych w nowoczesnej infrastrukturze jakie narzędzia są szczególnie przydatne do tworzenia potoków danych jak używać potoków danych do analizy i tworzenia raportów jakie są najważniejsze aspekty obsługi potoków, ich testowania i rozwiązywania problemów Poznaj najlepsze praktyki projektowania i implementacji potoków danych!
Power BI i Power Pivot dla Excela. Analiza danych
Profesjonalne modelowanie danych — pewny sukces w biznesie! Możliwości Excela są imponujące, a odkąd Microsoft udostępnił narzędzia w rodzaju Analysis Services, Power BI czy Power Pivot, arkusz ten stał się znakomitym narzędziem do analizy, modelowania oraz innych form przetwarzania dużych i złożonych zbiorów danych. Są to umiejętności, które przydadzą się w wielu dziedzinach życia, nie tylko w biznesie. Ich opanowanie nie jest zbyt trudne, a może stać się źródłem wielkiej radości i prawdziwej satysfakcji zwłaszcza dla każdego, kto lubi pracować z liczbami. Oczywiście osoby, które osiągną wysoki poziom umiejętności w tym zakresie, będą mogły liczyć na bardzo konkretne profity! Ta książka jest świetnym wprowadzeniem do modelowania danych w Excelu za pomocą narzędzi Power BI i Power Pivot. Dowiesz się z niej, jak optymalnie analizować zgromadzone dane i skutecznie wydobyć z nich potrzebne informacje. Zapoznasz się z ważnymi pojęciami i przyswoisz podstawowe techniki kształtowania modeli danych w Excelu i Power BI. Dzięki licznym praktycznym i przydatnym przykładom uzyskasz nową perspektywę — spojrzysz na zgromadzone dane okiem wytrawnego modelarza. Co więcej, szybko się przekonasz, że należyte zbudowanie modelu wcale nie jest trudne, a w efekcie przynosi prawidłowe odpowiedzi na wiele ważnych pytań! W tej książce między innymi: zasady i popularne techniki modelowania danych tabele faktów w złożonym modelu danych metody śledzenia atrybutów historycznych migawki i ich zastosowania analiza zdarzeń o określonym czasie trwania dobieranie rodzaju modelu do konkretnych pytań biznesowych Alberto Ferrari i Marco Russo od dwóch dekad zajmują się procesami business intelligence i Analysis Services. Obaj posiadają tytuły Microsoft MVP i SSAS Maestro. Często występują na prestiżowych konferencjach. Ferrari jest autorytetem w dziedzinie modelowania danych oraz usług analitycznych w dużych i złożonych hurtowniach danych, Russo specjalizuje się w analizie danych dla potrzeb wywiadu gospodarczego.
Power BI i sztuczna inteligencja. Jak w pełni wykorzystać funkcje AI dostępne w Power BI
Microsoft Power BI zdobył uznanie jako znakomite narzędzie do analizy i przetwarzania złożonych zbiorów danych, ale to nie koniec jego możliwości. Power BI nadaje się do wydobywania z modeli sztucznej inteligencji informacji, które mogą się stać wartościowym materiałem wspomagającym podejmowanie najlepszych decyzji biznesowych. Aby jednak w pełni skorzystać z funkcji dostępnych w Power BI, trzeba posiąść podstawową wiedzę o sztucznej inteligencji. Książka stanowi wprowadzenie do pracy z funkcjami SI dostępnymi w Power BI; jest skierowana do osób znających to środowisko. Dowiesz się z niej, w jaki sposób sztuczna inteligencja może być używana w Power BI i jakie funkcje są w nim domyślnie dostępne. Nauczysz się też eksplorować i przygotowywać dane do projektów SI. Pokazano tu, jak umieszczać dane z analizy tekstu i widzenia komputerowego w raportach Power BI, co ułatwia korzystanie z zewnętrznej bazy wiedzy. Omówiono również procesy tworzenia i wdrażania modeli AutoML wytrenowanych na platformie Azure ML, a także umieszczania ich w edytorze Power Query. Nie zabrakło kwestii związanych z prywatnością, bezstronnością i odpowiedzialnością w korzystaniu z SI. W książce między innymi: unikanie tendencyjności w przetwarzaniu danych szeregi czasowe i prognozowanie w Power BI wykrywanie anomalii analiza tekstu w Power Query trenowanie własnych modeli integracja Azure ML z Power BI i generowanie przewidywań Przekonaj się, jaki potencjał tkwi w analizie zbiorów danych!
MrExcel's Holy Macro! Books, Bill Jelen
Excel 2019 is more than just a spreadsheet tool; it's a powerful platform for solving complex data challenges. In this guide, MrExcel takes you through the essentials of Excel 2019, incorporating the latest features from Office 365. You'll start by mastering the Excel interface before moving on to advanced calculation techniques that streamline your workflow. The guide emphasizes data wrangling, teaching you how to transform raw data into meaningful insights with ease.Beyond calculations, you'll learn to create visually appealing spreadsheets that communicate your data effectively. MrExcel's approach combines problem-solving strategies with real-world scenarios, ensuring you gain practical skills that apply directly to your work. Reader-sourced tips and solutions to common user pitfalls are integrated throughout the guide, offering a personalized learning experience.By the end of this book, you'll have a solid understanding of Excel 2019's capabilities, enabling you to work faster, make informed decisions, and present your data professionally. Whether you're looking to enhance your existing skills or learn new techniques, MrExcel's expert guidance will help you master Excel and elevate your data analysis game.
Power Query is a data preparation tool that enables data engineers and business users to connect, reshape, enrich, and transform their data to facilitate relevant business insights and analysis. With Power Query's wide range of features, you can perform no-code transformations and complex M code functions at the same time to get the most out of your data.This Power Query book will help you to connect to data sources, achieve intuitive transformations, and get to grips with preparation practices. Starting with a general overview of Power Query and what it can do, the book advances to cover more complex topics such as M code and performance optimization. You'll learn how to extend these capabilities by gradually stepping away from the Power Query GUI and into the M programming language. Additionally, the book also shows you how to use Power Query Online within Power BI Dataflows.By the end of the book, you'll be able to leverage your source data, understand your data better, and enrich it with a full stack of no-code and custom features that you'll learn to design by yourself for your business requirements.
Power Query w Excelu i Power BI. Zbieranie i przekształcanie danych
Czy praca na danych kojarzy Ci się z frustrującym ręcznym wklejaniem i oczyszczaniem danych w Excelu? A może tracisz mnóstwo energii na importowanie nieuporządkowanych danych pochodzących z różnych źródeł? Być może podejrzewasz, że Twoje arkusze kryją mnóstwo wartościowych informacji, ale nie wiesz, w jaki sposób je wydobyć i ile godzin musisz na to poświęcić? A może spędzasz sporo czasu na tworzeniu skomplikowanych raportów w Power BI lub programowaniu baz danych SQL Server? Dzięki wiedzy zawartej w tej książce wykonasz te zadania prościej i szybciej, a efekty będą o wiele bardziej niezawodne! Ten praktyczny przewodnik po narzędziu Power Query nauczy Cię efektywnie przetwarzać dane w Excelu: importować, oczyszczać, przekształcać i wydobywać potrzebne informacje. Dowiesz się, jak sprawnie wykonywać typowe zadania i prace analityczne, jak zwiększyć swoją skuteczność dzięki opanowaniu podstaw języka M oraz jak zautomatyzować proces przygotowywania danych do przetwarzania. Zapoznasz się z możliwościami Microsoft Cognitive Services oraz konektora Power Query Web, a także z wykorzystaniem sztucznej inteligencji do rozpoznawania treści tekstu. Nabyte umiejętności będziesz mógł przetestować w realistycznym projekcie, któremu poświęcono ostatni rozdział! W książce między innymi: solidne podstawy pracy z narzędziem Power Query automatyzacja operacji na danych proste i zaawansowane techniki dekompozycji tabel tworzenie procedur w języku M pozyskiwanie informacji z danych tekstowych i sieci społecznościowych Power Query i Power BI: sprostasz wyzwaniu przetwarzania danych!
Power Query w Excelu i Power BI. Zbieranie i przekształcanie danych. Wydanie II
Czy chcesz dokonywać cudów z danymi, unikać powtarzalnej pracy i oszczędzać nawet 80 procent czasu? Zautomatyzować kopiowanie i żmudne oczyszczanie danych, aby doprowadzić je do odpowiedniego stanu? A może chcesz ze spokojem podchodzić do podejmowania racjonalnych decyzji opartych na ogromnych ilościach niejednorodnych danych? Teraz możesz łatwo sprostać takim wyzwaniom i uzyskiwać niezwykłe rezultaty. Wystarczy, że skorzystasz z narzędzi dostępnych w Excelu ― i z tej książki. To zaktualizowane wydanie praktycznego przewodnika po Power Query. Pozwoli Ci opanować umiejętność efektywnego przetwarzania danych i wydobywania z nich wartościowych informacji. Dowiesz się, jak wykonywać złożone prace analityczne i jak używać procedur w języku M. Znajdziesz tu ponad 70 ćwiczeń i 200 plików, dzięki którym nauczysz się importować bezładne, rozdzielone tabele danych i automatycznie przekształcać je w ustrukturyzowane zbiory gotowe do analizy. Większość opisanych technik z łatwością zapamiętasz i użyjesz do swoich potrzeb. W książce między innymi: solidne podstawy pracy z narzędziem Power Query proste i zaawansowane techniki dekompozycji tabel tworzenie elastycznych procedur w języku M pozyskiwanie informacji z danych tekstowych i sieci społecznościowych profilowanie danych i poprawianie wydajności zapytań Power Query i Power BI: więcej i lepiej w krótszym czasie!
Poznaj Microsoft Power BI. Przekształcanie danych we wnioski
Microsoft Power BI jest narzędziem do analizowania i wizualizacji danych - na tyle potężnym, aby móc sprostać potrzebom nawet najbardziej wymagających danologów, a jednocześnie na tyle przystępnym, aby mogło być używane na co dzień przez każdego, kto chce uzyskać więcej informacji ze swoich danych. Na rynku dostępnych jest wiele książek projektowanych pod kątem szkolenia profesjonalnych analityków danych z obsługi Power BI, jednak niewiele z nich czyni to narzędzie przystępnym dla osób, które chciałyby samodzielnie nadrobić zaległości. To usprawnione wprowadzenie do Power BI obejmuje wszystkie podstawowe aspekty i funkcje pozwalające przejść "od zera do bohatera" w pracy z danymi i wizualizacjami. Bez względu na to, czy pracujesz z dużymi złożonymi zbiorami danych, czy też pracujesz w programie Microsoft Excel, autor Jeremey Arnold pokazuje Ci, jak nauczyć się Power BI i używać go jako zwykłego narzędzia do analizowania i raportowania danych. Nauczysz się: - Importować, manipulować, wizualizować i badać dane w Power BI - Znajdować rozwiązania dla samoobsługi i analizy biznesowej dla przedsiębiorstw - Wykorzystywać Power BI w strategii analizy biznesowej swojej organizacji - Tworzyć efektywne raporty i pulpity nawigacyjne - Tworzyć środowiska do udostępniania raportów i zarządzania dostępem do danych w obrębie swojego zespołu - Określać właściwe rozwiązania w zakresie wykorzystywania oferty Power BI, w zależności od potrzeb związanych z rozmiarem, bezpieczeństwem i złożonością obliczeń Jeremey Arnold jest starszym architektem analizy danych w Onebridge, dużej firmie konsultingowej zajmującej się analizowaniem danych, z siedzibą w Indianapolis w stanie Indiana. Jeremey analizą danych zajmuje się od ponad dekady, a z narzędzia Microsoft Power BI korzysta od czasu jego wydania w roku 2013. Jego doświadczenie rozciąga się na wiele różnych sektorów, w tym opiekę zdrowotną, finanse, produkcję czy sektor publiczny. W swojej pracy skupia się głównie na przekształcaniu danych we wnioski i tworzeniu środowisk opartych na danych.
Dane stały się paliwem rozwoju cywilizacji. Wykorzystanie ich potencjału jest jednak trudne: problemem okazuje się wyciąganie z nich informacji i wniosków, aby można było na ich podstawie podejmować trafne decyzje. Jednym z narzędzi ułatwiających tę pracę jest Tableau - program do analityki danych, który umożliwia ich zrozumienie, interpretację i prowadzenie na nich efektywnych działań. Dzięki tej książce płynnie rozpoczniesz pracę z Tableau 2022 i nauczysz się wizualizacji danych. Dowiesz się, jak je analizować i przedstawiać w formie graficznej, a także jak opowiadać oparte na nich historie. W tym wydaniu ujęto najnowsze funkcje programu, między innymi rozszerzenia pulpitów nawigacyjnych, Explain Data i integrację z CRM Analytics (Einstein Analytics), służącym do modelowania predyktywnego w Tableau. Pokazano również, jak używać tabel i obliczeń na różnych poziomach szczegółowości i stosować wizualną analitykę statystyczną. Następnie zademonstrowano techniki łączenia różnych źródeł danych z funkcjonalnościami modeli danych Tableau wraz z mapami i wizualizacjami geoprzestrzennymi. Z tego przewodnika dowiesz się też, jak korzystać z funkcji Tableau Prep Builder, by skutecznie oczyścić i zorganizować dane. Dzięki książce nauczysz się: tworzyć zachwycające wizualizacje złożonych danych budować interaktywne pulpity nawigacyjne korzystać z obliczeń w celu rozwiązywania problemów i uzupełniania analiz wzbogacać możliwości Tableau poprzez rozszerzenia, skrypty i CRM Analytics oczyszczać i organizować dane w Tableau tworzyć angażujące historie oparte na danych Przekonaj się, co Tableau wyczaruje z Twoich danych!


