Verleger: 8

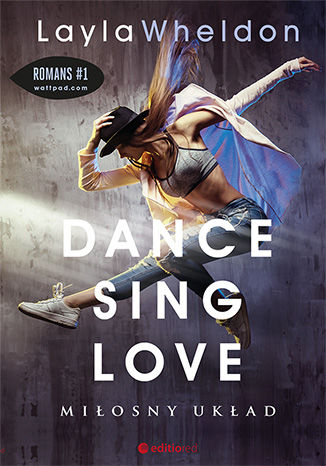
Dance, sing, love. Miłosny układ
Layla Wheldon
Numer 1 na wattpad.com w kategorii Romans — ponad 2,5 miliona odsłon! Livia Innocenti jest zawodową tancerką. Razem z zespołem robi show podczas koncertów i teledysków największych gwiazd muzyki. James Sheridan jest topowym piosenkarzem, bożyszczem fanek i ulubieńcem portali plotkarskich. Spotykają się w Rzymie w czasie wspólnego tournée po Europie. Livia szybko przekonuje się, że woda sodowa uderzyła młodemu celebrycie do głowy. Nikt jej tak nie wkurza na próbach, jak arogancki i egoistyczny James. Na dodatek choreografia przewiduje kilka utworów w ich wykonaniu w duecie. Początkowo nie potrafią się dogadać i nawzajem się ignorują, jednak serca nie da się oszukać, nie na dłuższą metę. Czy będzie to szczęśliwy układ? Jakie role przyjdzie im wspólnie zatańczyć w tej historii? Podążanie za głosem serca nie zawsze jest takie proste, jak się wydaje, i nie zawsze słuszne. Czasem kierowanie się rozumem jest najlepszą drogą, bo miłość, zamiast uszczęśliwiać, potrafi sprawiać ból. Zatrać się w historii pełnej pasji, pożądania, zwrotów akcji i gorących rytmów. Po prostu dance & sing & love!
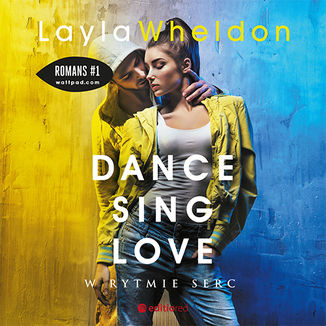
Dance, sing, love. W rytmie serc
Layla Wheldon
Kontynuacja bestsellerowego Miłosnego układu! Po tragicznym wydarzeniu na lotnisku Livia Innocenti na długo straciła zdrowie i pełną sprawność - kariera tancerki stanęła więc pod znakiem zapytania. Z pomocą swojego chłopaka Jamesa Sheridana oraz przy wsparciu przyjaciół, Kathy, Zafira, Leny, Mirandy i Alexis, Livia powoli staje na nogi. Odnajduje spokój i ukojenie w muzyce i tańcu, które stają się elementem terapii. Dostaje także propozycję, by spróbowała swoich sił jako choreograf. Czas zabliźnia rany, jednak trauma po wypadku nie daje o sobie zapomnieć. Problemy nie znikają, podobnie jak powracające nocami koszmary. Kiedy wydaje się, że wszystko się wreszcie układa, a związek Livii z Jamesem wchodzi na właściwe tory, los wystawia ich uczucie na ciężką próbę. I zrobi to jeszcze nieraz. Czy ich serca nadal będą bić w jednakowym rytmie? Więcej muzyki, więcej tańca i więcej pasji... Po prostu DANCE & SING & LOVE! Kontynuacja godna swojej poprzedniczki. A nawet lepsza! W rytmie serc to wyjątkowo wciągająca, zaskakująca i poruszająca historia Livii, która po tragicznym wydarzeniu uczy się żyć na nowo. Layla Wheldon stworzyła historię pełną pasji, namiętności i prawdziwych emocji. Musicie przeczytać! Gorąco polecam! Hanna Smarzewska, www.nie-oceniam-po-okladkach.blogspot.com Miłosny układ był zaledwie zarodkiem cudownej opowieści, która z całą pewnością zostanie na długo zapamiętana. Emocje targają nami bezlitośnie, ale niczym masochiści chcemy coraz więcej i więcej. Nie sposób się tym nasycić, a W rytmie serc wcale nas nie oszczędzi. Sara Kalecka, www.pelna-kulturka.pl Czytając W rytmie serc, już od pierwszych stron będziesz przeżywać emocjonalny rollercoaster, od łez, przez złość do niekontrolowanych wybuchów śmiechu. Poznasz Livię na nowo i będziesz żyć jej historią, która przepełniona jest miłością, pasją i muzyką. Nie dasz rady odłożyć tej książki na półkę, zanim nie poznasz dalszych losów głównych bohaterów... Patrycka Wakuła, kredziarecenzuje.blogspot.com Layla Wheldon to jedna z niewielu autorek, której książki czytam z przyjemnością. Dance. Sing. Love. W rytmie serc to skomplikowana i burzliwa kontynuacja losów Jamesa i Livii. Bohaterów czeka wiele życiowych niespodzianek, a im samym pozostanie zmierzyć się z wątpliwościami i brakiem zaufania. Czy podołają wyzwaniom, które stawia przed nimi los? Ewelina Żyła, redgirlbooks.blogspot.com Świat show-biznesu rządzi się własnymi prawami, więc kiedy życie daje drugą szansę, trzeba z niej korzystać ile się da. Przekonują się o tym Livia i James. Zanurz się po raz kolejny w tej muzycznej historii i zobacz, z czym przyjdzie się zmierzyć bohaterom! Dominika Emilia Lewandowska, youtube.com/c/LifebyBookaholic
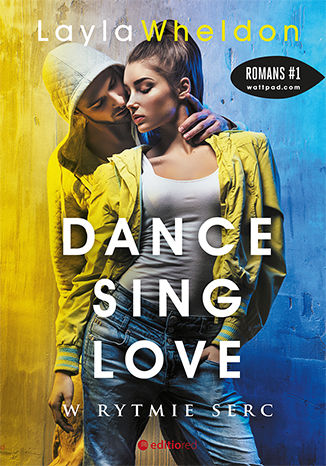

Maria Pawlikowska-Jasnorzewska
Zanurz się w fascynujący świat poezji z ebookiem "Dancing" autorstwa Marii Pawlikowskiej-Jasnorzewskiej, wybitnej polskiej poetki, której twórczość zachwyca czytelników od pokoleń. "Dancing" to zbiór wierszy, które jak taniec łączą w sobie lekkość, elegancję i głębię emocji. Pawlikowska-Jasnorzewska w mistrzowski sposób oddaje dynamikę życia, miłości i namiętności, tworząc poetyckie obrazy, które poruszają i inspirują. Każdy wiersz to krok w tanecznej podróży przez ludzkie uczucia i doświadczenia, pełen piękna i refleksji. Pozwól sobie na tę literacką przygodę i odkryj, jak słowa mogą tańczyć w Twojej wyobraźni, przynosząc radość, wzruszenie i chwilę wytchnienia. "Dancing" to ebook, który z pewnością wzbogaci Twoją biblioteczkę i serce.
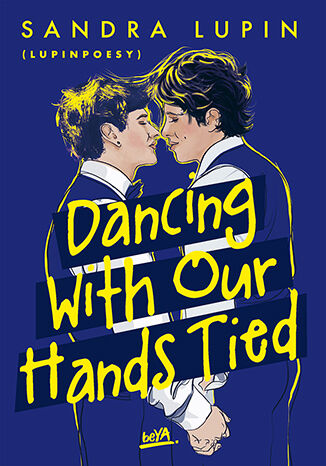
Sandra Lupin - "lupinpoesy"
Zupełnie inna bajka Louis Alexander Mountford-Windsor, dwudziestoletni książę Cambridge, to chodzący ideał. Miły, inteligentny i zabawny, jest obiektem westchnień dziewcząt na całym świecie. Aktualnie kończy studia, a równocześnie przygotowuje się do nowej życiowej roli. Już za kilkanaście miesięcy Louis zostanie mężem uroczej duńskiej księżniczki Grace. Od dnia ślubu para będzie razem podbijać ludzkie serca... Za rok o tej porze Louis Alexander będzie miał żonę. Żonę! Na samą myśl o tym księciem wstrząsa dreszcz. Nie dlatego, że nie lubi Grace. Przeciwnie, księżniczka Danii to wspaniała dziewczyna. Louis ją kocha, ale... tylko jako przyjaciółkę. Grace nie budzi w nim romantycznych uczuć. Inaczej rzecz ma się z jej bratem. Gabriel Holstein jest o kilka lat starszy, nieco roztrzepany i bardzo, bardzo szalony. Czy książę Cambridge pozwoli, aby szaleństwo wkroczyło również do jego życia? Czy wreszcie zdecyduje się przekroczyć własne granice?
Dancing with Python. Learn to code with Python and Quantum Computing
Robert S. Sutor
Dancing with Python helps you learn Python and quantum computing in a practical way. It will help you explore how to work with numbers, strings, collections, iterators, and files.The book goes beyond functions and classes and teaches you to use Python and Qiskit to create gates and circuits for classical and quantum computing. Learn how quantum extends traditional techniques using the Grover Search Algorithm and the code that implements it. Dive into some advanced and widely used applications of Python and revisit strings with more sophisticated tools, such as regular expressions and basic natural language processing (NLP). The final chapters introduce you to data analysis, visualizations, and supervised and unsupervised machine learning.By the end of the book, you will be proficient in programming the latest and most powerful quantum computers, the Pythonic way.
Robert S. Sutor
Dancing with Qubits, Second Edition, is a comprehensive quantum computing textbook that starts with an overview of why quantum computing is so different from classical computing and describes several industry use cases where it can have a major impact. A full description of classical computing and the mathematical underpinnings of quantum computing follows, helping you better understand concepts such as superposition, entanglement, and interference. Next up are circuits and algorithms, both basic and sophisticated, as well as a survey of the physics and engineering ideas behind how quantum computing hardware is built. Finally, the book looks to the future and gives you guidance on understanding how further developments may affect you.This new edition is updated throughout with more than 100 new exercises and includes new chapters on NISQ algorithms and quantum machine learning.Understanding quantum computing requires a lot of math, and this book doesn't shy away from the necessary math concepts you'll need. Each topic is explained thoroughly and with helpful examples, leaving you with a solid foundation of knowledge in quantum computing that will help you pursue and leverage quantum-led technologies.