Categories
Ebooks
-
Business and economy
- Bitcoin
- Businesswoman
- Coaching
- Controlling
- E-business
- Economy
- Finances
- Stocks and investments
- Personal competence
- Computer in the office
- Communication and negotiation
- Small company
- Marketing
- Motivation
- Multimedia trainings
- Real estate
- Persuasion and NLP
- Taxes
- Social policy
- Guides
- Presentations
- Leadership
- Public Relation
- Reports, analyses
- Secret
- Social Media
- Sales
- Start-up
- Your career
- Management
- Project management
- Human Resources
-
For children
-
For youth
-
Education
-
Encyclopedias, dictionaries
-
E-press
- Architektura i wnętrza
- Health and Safety
- Biznes i Ekonomia
- Home and garden
- E-business
- Ekonomia i finanse
- Esoterecism
- Finances
- Personal finance
- Business
- Photography
- Computer science
- HR & Payroll
- For women
- Computers, Excel
- Accounts
- Culture and literature
- Scientific and academic
- Environmental protection
- Opinion-forming
- Education
- Taxes
- Travelling
- Psychology
- Religion
- Agriculture
- Book and press market
- Transport and Spedition
- Healthand beauty
-
History
-
Computer science
- Office applications
- Data bases
- Bioinformatics
- IT business
- CAD/CAM
- Digital Lifestyle
- DTP
- Electronics
- Digital photography
- Computer graphics
- Games
- Hacking
- Hardware
- IT w ekonomii
- Scientific software package
- School textbooks
- Computer basics
- Programming
- Mobile programming
- Internet servers
- Computer networks
- Start-up
- Operational systems
- Artificial intelligence
- Technology for children
- Webmastering
-
Other
-
Foreign languages
-
Culture and art
-
School reading books
-
Literature
- Antology
- Ballade
- Biographies and autobiographies
- For adults
- Dramas
- Diaries, memoirs, letters
- Epic, epopee
- Essay
- Fantasy and science fiction
- Feuilletons
- Work of fiction
- Humour and satire
- Other
- Classical
- Crime fiction
- Non-fiction
- Fiction
- Mity i legendy
- Nobelists
- Novellas
- Moral
- Okultyzm i magia
- Short stories
- Memoirs
- Travelling
- Narrative poetry
- Poetry
- Politics
- Popular science
- Novel
- Historical novel
- Prose
- Adventure
- Journalism, publicism
- Reportage novels
- Romans i literatura obyczajowa
- Sensational
- Thriller, Horror
- Interviews and memoirs
-
Natural sciences
-
Social sciences
-
School textbooks
-
Popular science and academic
- Archeology
- Bibliotekoznawstwo
- Cinema studies
- Philology
- Polish philology
- Philosophy
- Finanse i bankowość
- Geography
- Economy
- Trade. World economy
- History and archeology
- History of art and architecture
- Cultural studies
- Linguistics
- Literary studies
- Logistics
- Maths
- Medicine
- Humanities
- Pedagogy
- Educational aids
- Popular science
- Other
- Psychology
- Sociology
- Theatre studies
- Theology
- Economic theories and teachings
- Transport i spedycja
- Physical education
- Zarządzanie i marketing
-
Guides
-
Game guides
-
Professional and specialist guides
-
Law
- Health and Safety
- History
- Road Code. Driving license
- Law studies
- Healthcare
- General. Compendium of knowledge
- Academic textbooks
- Other
- Construction and local law
- Civil law
- Financial law
- Economic law
- Economic and trade law
- Criminal law
- Criminal law. Criminal offenses. Criminology
- International law
- International law
- Health care law
- Educational law
- Tax law
- Labor and social security law
- Public, constitutional and administrative law
- Family and Guardianship Code
- agricultural law
- Social law, labour law
- European Union law
- Industry
- Agricultural and environmental
- Dictionaries and encyclopedia
- Public procurement
- Management
-
Tourist guides and travel
- Africa
- Albums
- Southern America
- North and Central America
- Australia, New Zealand, Oceania
- Austria
- Asia
- Balkans
- Middle East
- Bulgary
- China
- Croatia
- The Czech Republic
- Denmark
- Egipt
- Estonia
- Europe
- France
- Mountains
- Greece
- Spain
- Holand
- Iceland
- Lithuania
- Latvia
- Mapy, Plany miast, Atlasy
- Mini travel guides
- Germany
- Norway
- Active travelling
- Poland
- Portugal
- Other
- Przewodniki po hotelach i restauracjach
- Russia
- Romania
- Slovakia
- Slovenia
- Switzerland
- Sweden
- World
- Turkey
- Ukraine
- Hungary
- Great Britain
- Italy
-
Psychology
- Philosophy of life
- Kompetencje psychospołeczne
- Interpersonal communication
- Mindfulness
- General
- Persuasion and NLP
- Academic psychology
- Psychology of soul and mind
- Work psychology
- Relacje i związki
- Parenting and children psychology
- Problem solving
- Intellectual growth
- Secret
- Sexapeal
- Seduction
- Appearance and image
- Philosophy of life
-
Religion
-
Sport, fitness, diets
-
Technology and mechanics
Audiobooks
-
Business and economy
- Bitcoin
- Businesswoman
- Coaching
- Controlling
- E-business
- Economy
- Finances
- Stocks and investments
- Personal competence
- Communication and negotiation
- Small company
- Marketing
- Motivation
- Real estate
- Persuasion and NLP
- Taxes
- Social policy
- Guides
- Presentations
- Leadership
- Public Relation
- Secret
- Social Media
- Sales
- Start-up
- Your career
- Management
- Project management
- Human Resources
-
For children
-
For youth
-
Education
-
Encyclopedias, dictionaries
-
E-press
-
History
-
Computer science
-
Other
-
Foreign languages
-
Culture and art
-
School reading books
-
Literature
- Antology
- Ballade
- Biographies and autobiographies
- For adults
- Dramas
- Diaries, memoirs, letters
- Epic, epopee
- Essay
- Fantasy and science fiction
- Feuilletons
- Work of fiction
- Humour and satire
- Other
- Classical
- Crime fiction
- Non-fiction
- Fiction
- Mity i legendy
- Nobelists
- Novellas
- Moral
- Okultyzm i magia
- Short stories
- Memoirs
- Travelling
- Poetry
- Politics
- Popular science
- Novel
- Historical novel
- Prose
- Adventure
- Journalism, publicism
- Reportage novels
- Romans i literatura obyczajowa
- Sensational
- Thriller, Horror
- Interviews and memoirs
-
Natural sciences
-
Social sciences
-
Popular science and academic
-
Guides
-
Professional and specialist guides
-
Law
-
Tourist guides and travel
-
Psychology
- Philosophy of life
- Interpersonal communication
- Mindfulness
- General
- Persuasion and NLP
- Academic psychology
- Psychology of soul and mind
- Work psychology
- Relacje i związki
- Parenting and children psychology
- Problem solving
- Intellectual growth
- Secret
- Sexapeal
- Seduction
- Appearance and image
- Philosophy of life
-
Religion
-
Sport, fitness, diets
-
Technology and mechanics
Videocourses
-
Data bases
-
Big Data
-
Biznes, ekonomia i marketing
-
Cybersecurity
-
Data Science
-
DevOps
-
For children
-
Electronics
-
Graphics/Video/CAX
-
Games
-
Microsoft Office
-
Development tools
-
Programming
-
Personal growth
-
Computer networks
-
Operational systems
-
Software testing
-
Mobile devices
-
UX/UI
-
Web development
-
Management
Podcasts
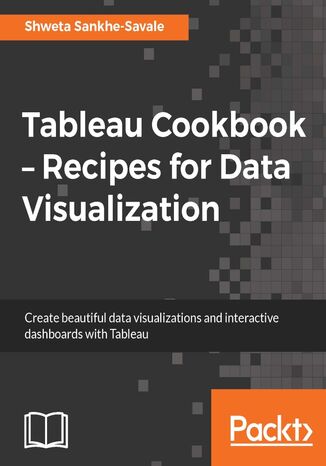
Tableau Cookbook - Recipes for Data Visualization. Click here to enter text
Data is everywhere and everything is data! Visualization of data allows us to bring out the underlying trends and patterns inherent in the data and gain insights that enable faster and smarter decision making. Tableau is one of the fastest growing and industry leading Business Intelligence platforms that empowers business users to easily visualize their data and discover insights at the speed of thought. Tableau is a self-service BI platform designed to make data visualization and analysis as intuitive as possible. Creating visualizations with simple drag-and-drop, you can be up and running on Tableau in no time.Starting from the fundamentals such as getting familiarized with Tableau Desktop, connecting to common data sources and building standard charts; you will walk through the nitty gritty of Tableau such as creating dynamic analytics with parameters, blended data sources, and advanced calculations. You will also learn to group members into higher levels, sort the data in a specific order & filter out the unnecessary information. You will then create calculations in Tableau & understand the flexibility & power they have and go on to building story-boards and share your insights with others.Whether you are just getting started or whether you need a quick reference on a “how-to” question, This book is the perfect companion for you
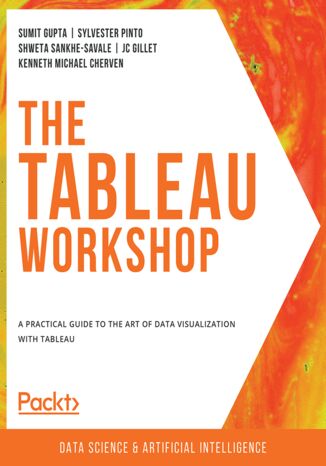
The Tableau Workshop. A practical guide to the art of data visualization with Tableau
Sumit Gupta, Sylvester Pinto, Shweta Sankhe-Savale, JC Gillet, ...
Learning Tableau has never been easier, thanks to this practical introduction to storytelling with data. The Tableau Workshop breaks down the analytical process into five steps: data preparation, data exploration, data analysis, interactivity, and distribution of dashboards. Each stage is addressed with a clear walkthrough of the key tools and techniques you'll need, as well as engaging real-world examples, meaningful data, and practical exercises to give you valuable hands-on experience.As you work through the book, you'll learn Tableau step by step, studying how to clean, shape, and combine data, as well as how to choose the most suitable charts for any given scenario. You'll load data from various sources and formats, perform data engineering to create new data that delivers deeper insights, and create interactive dashboards that engage end-users.All concepts are introduced with clear, simple explanations and demonstrated through realistic example scenarios. You'll simulate real-world data science projects with use cases such as traffic violations, urban populations, coffee store sales, and air travel delays.By the end of this Tableau book, you'll have the skills and knowledge to confidently present analytical results and make data-driven decisions.


