Kategorien
-
- Bitcoin
- Geschäftsfrau
- Coaching
- Controlling
- E-Business
- Ökonomie
- Finanzen
- Börse und Investitionen
- Persönliche Kompetenzen
- Computer im Büro
- Kommunikation und Verhandlungen
- Kleines Unternehmen
- Marketing
- Motivation
- Multimedia-Training
- Immobilien
- Überzeugung und NLP
- Steuern
- Sozialpolitik
- Handbȕcher
- Präsentationen
- Führung
- Public Relation
- Berichte, Analysen
- Geheimnis
- Social Media
- Verkauf
- Start-up
- Ihre Karriere
- Management
- Projektmanagement
- Personal (HR)
-
- Architektura i wnętrza
- Sicherheit und Gesundheit am Arbeitsplatz
- Biznes i Ekonomia
- Haus und Garten
- E-Business
- Ekonomia i finanse
- Esoterik
- Finanzen
- Persönliche Finanzen
- Unternehmen
- Fotografie
- Informatik
- HR und Gehaltsabrechnung
- Frauen
- Computer, Excel
- Buchhaltung
- Kultur und Literatur
- Wissenschaftlich und akademisch
- Umweltschutz
- meinungsbildend
- Bildung
- Steuern
- Reisen
- Psychologie
- Religion
- Landwirtschaft
- Buch- und Pressemarkt
- Transport und Spedition
- Gesundheit und Schönheit
-
- Office-Programme
- Datenbank
- Bioinformatik
- IT Branche
- CAD/CAM
- Digital Lifestyle
- DTP
- Elektronik
- Digitale Fotografie
- Computergrafik
- Spiele
- Hacking
- Hardware
- IT w ekonomii
- Wissenschaftliche Pakete
- Schulbücher
- Computergrundlagen
- Programmierung
- Mobile-Programmierung
- Internet-Server
- Computernetzwerke
- Start-up
- Betriebssysteme
- Künstliche Inteligenz
- Technik für Kinder
- Webmaster
-
- Anthologien
- Ballade
- Biografien und Autobiografien
- Für Erwachsene
- Drama
- Tagebücher, Memoiren, Briefe
- Epos
- Essay
- Science Fiction
- Felietonys
- Fiktion
- Humor, Satire
- Andere
- Klassisch
- Krimi
- Sachbücher
- Belletristik
- Mity i legendy
- Nobelpreisträger
- Kurzgeschichten
- Gesellschaftlich
- Okultyzm i magia
- Erzählung
- Erinnerungen
- Reisen
- Gedicht
- Poesie
- Politik
- Populärwissenschaftlich
- Roman
- Historischer Roman
- Prosa
- Abenteuer
- Journalismus
- Reportage
- Romans i literatura obyczajowa
- Sensation
- Thriller, Horror
- Interviews und Erinnerungen
-
- Archäologie
- Bibliotekoznawstwo
- Filmwissenschaft
- Philologie
- Polnische Philologie
- Philosophie
- Finanse i bankowość
- Erdkunde
- Wirtschaft
- Handel. Weltwirtschaft
- Geschichte und Archäologie
- Kunst- und Architekturgeschichte
- Kulturwissenschaft
- Linguistik
- Literaturwissenschaft
- Logistik
- Mathematik
- Medizin
- Geisteswissenschaften
- Pädagogik
- Lehrmittel
- Populärwissenschaftlich
- Andere
- Psychologie
- Soziologie
- Theatrologie
- Teologie
- Theorien und Wirtschaftswissenschaften
- Transport i spedycja
- Sportunterricht
- Zarządzanie i marketing
-
- Sicherheit und Gesundheit am Arbeitsplatz
- Geschichte
- Verkehrsregeln. Führerschein
- Rechtswissenschaften
- Gesundheitswesen
- Allgemeines. Wissenskompendium
- akademische Bücher
- Andere
- Bau- und Wohnungsrecht
- Zivilrecht
- Finanzrecht
- Wirtschaftsrecht
- Wirtschafts- und Handelsrecht
- Strafrecht
- Strafrecht. Kriminelle Taten. Kriminologie
- Internationales Recht
- Internationales und ausländisches Recht
- Gesundheitsschutzgesetz
- Bildungsrecht
- Steuerrecht
- Arbeits- und Sozialversicherungsrecht
- Öffentliches, Verfassungs- und Verwaltungsrecht
- Familien- und Vormundschaftsrecht
- Agrarrecht
- Sozialrecht, Arbeitsrecht
- EU-Recht
- Industrie
- Agrar- und Umweltschutz
- Wörterbücher und Enzyklopädien
- Öffentliche Auftragsvergabe
- Management
-
- Afrika
- Alben
- Südamerika
- Mittel- und Nordamerika
- Australien, Neuseeland, Ozeanien
- Österreich
- Asien
- Balkan
- Naher Osten
- Bulgarien
- China
- Kroatien
- Tschechische Republik
- Dänemark
- Ägypten
- Estland
- Europa
- Frankreich
- Berge
- Griechenland
- Spanien
- Niederlande
- Island
- Litauen
- Lettland
- Mapy, Plany miast, Atlasy
- Miniführer
- Deutschland
- Norwegen
- Aktive Reisen
- Polen
- Portugal
- Andere
- Przewodniki po hotelach i restauracjach
- Russland
- Rumänien
- Slowakei
- Slowenien
- Schweiz
- Schweden
- Welt
- Türkei
- Ukraine
- Ungarn
- Großbritannien
- Italien
-
- Lebensphilosophien
- Kompetencje psychospołeczne
- zwischenmenschliche Kommunikation
- Mindfulness
- Allgemeines
- Überzeugung und NLP
- Akademische Psychologie
- Psychologie von Seele und Geist
- Arbeitspsychologie
- Relacje i związki
- Elternschafts- und Kinderpsychologie
- Problemlösung
- Intellektuelle Entwicklung
- Geheimnis
- Sexualität
- Verführung
- Aussehen ind Image
- Lebensphilosophien
-
- Bitcoin
- Geschäftsfrau
- Coaching
- Controlling
- E-Business
- Ökonomie
- Finanzen
- Börse und Investitionen
- Persönliche Kompetenzen
- Kommunikation und Verhandlungen
- Kleines Unternehmen
- Marketing
- Motivation
- Immobilien
- Überzeugung und NLP
- Steuern
- Sozialpolitik
- Handbȕcher
- Präsentationen
- Führung
- Public Relation
- Geheimnis
- Social Media
- Verkauf
- Start-up
- Ihre Karriere
- Management
- Projektmanagement
- Personal (HR)
-
- Anthologien
- Ballade
- Biografien und Autobiografien
- Für Erwachsene
- Drama
- Tagebücher, Memoiren, Briefe
- Epos
- Essay
- Science Fiction
- Felietonys
- Fiktion
- Humor, Satire
- Andere
- Klassisch
- Krimi
- Sachbücher
- Belletristik
- Mity i legendy
- Nobelpreisträger
- Kurzgeschichten
- Gesellschaftlich
- Okultyzm i magia
- Erzählung
- Erinnerungen
- Reisen
- Poesie
- Politik
- Populärwissenschaftlich
- Roman
- Historischer Roman
- Prosa
- Abenteuer
- Journalismus
- Reportage
- Romans i literatura obyczajowa
- Sensation
- Thriller, Horror
- Interviews und Erinnerungen
-
- Archäologie
- Philosophie
- Wirtschaft
- Handel. Weltwirtschaft
- Geschichte und Archäologie
- Kunst- und Architekturgeschichte
- Kulturwissenschaft
- Literaturwissenschaft
- Mathematik
- Medizin
- Geisteswissenschaften
- Pädagogik
- Lehrmittel
- Populärwissenschaftlich
- Andere
- Psychologie
- Soziologie
- Teologie
- Zarządzanie i marketing
-
- Lebensphilosophien
- zwischenmenschliche Kommunikation
- Mindfulness
- Allgemeines
- Überzeugung und NLP
- Akademische Psychologie
- Psychologie von Seele und Geist
- Arbeitspsychologie
- Relacje i związki
- Elternschafts- und Kinderpsychologie
- Problemlösung
- Intellektuelle Entwicklung
- Geheimnis
- Sexualität
- Verführung
- Aussehen ind Image
- Lebensphilosophien
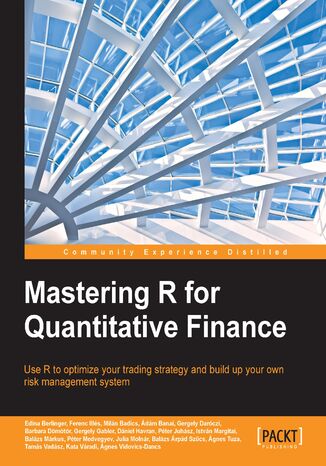
- Edina Berlinger (EURO), Julia Molnár, Agnes Vidovics Dancs, Barbara Dömötör, Dániel Havran, Gergely Gabler, Gergely Daróczi, Tamás Vadász, Margitai István, PATTERN Oktatasi es Informatikai Tanacsado BT, Kata Váradi, Balázs Márkus, Balázs Árpád Sz?+-cs, Ferenc Illés, Ádám Banai, Péter Medvegyev, Péter Juhász
R: Data Analysis and Visualization. Click here to enter text
Tony Fischetti, Brett Lantz, Jaynal Abedin, Hrishi V. Mittal, ...
The R learning path created for you has five connected modules, which are a mini-course in their own right. As you complete each one, you'll have gained key skills and be ready for the material in the next module!This course begins by looking at the Data Analysis with R module. This will help you navigate the R environment. You'll gain a thorough understanding of statistical reasoning and sampling. Finally, you'll be able to put best practices into effect to make your job easier and facilitate reproducibility.The second place to explore is R Graphs, which will help you leverage powerful default R graphics and utilize advanced graphics systems such as lattice and ggplot2, the grammar of graphics. You'll learn how to produce, customize, and publish advanced visualizations using this popular and powerful framework.With the third module, Learning Data Mining with R, you will learn how to manipulate data with R using code snippets and be introduced to mining frequent patterns, association, and correlations while working with R programs.The Mastering R for Quantitative Finance module pragmatically introduces both the quantitative finance concepts and their modeling in R, enabling you to build a tailor-made trading system on your own. By the end of the module, you will be well-versed with various financial techniques using R and will be able to place good bets while making financial decisions.Finally, we'll look at the Machine Learning with R module. With this module, you'll discover all the analytical tools you need to gain insights from complex data and learn how to choose the correct algorithm for your specific needs. You'll also learn to apply machine learning methods to deal with common tasks, including classification, prediction, forecasting, and so on.


