Категорії
Електронні книги
-
Бізнес та економіка
- Біткойн
- Ділова жінка
- Коучинг
- Контроль
- Електронний бізнес
- Економіка
- Фінанси
- Фондова біржа та інвестиції
- Особисті компетенції
- Комп'ютер в офісі
- Комунікація та переговори
- Малий бізнес
- Маркетинг
- Мотивація
- Мультимедійне навчання
- Нерухомість
- Переконання та НЛП
- Податки
- Соціальна політика
- Порадники
- Презентації
- Лідерство
- Зв'язки з громадськістю
- Звіти, аналізи
- Секрет
- Соціальні засоби комунікації
- Продаж
- Стартап
- Ваша кар'єра
- Управління
- Управління проектами
- Людські ресурси (HR)
-
Для дітей
-
Для молоді
-
Освіта
-
Енциклопедії, словники
-
Електронна преса
- Architektura i wnętrza
- Безпека життєдіяльності
- Biznes i Ekonomia
- Будинок та сад
- Електронний бізнес
- Ekonomia i finanse
- Езотерика
- Фінанси
- Особисті фінанси
- Бізнес
- Фотографія
- Інформатика
- Відділ кадрів та оплата праці
- Для жінок
- Комп'ютери, Excel
- Бухгалтерія
- Культура та література
- Наукові та академічні
- Охорона навколишнього середовища
- Впливові
- Освіта
- Податки
- Подорожі
- Психологія
- Релігія
- Сільське господарство
- Ринок книг і преси
- Транспорт та спедиція
- Здоров'я та краса
-
Історія
-
Інформатика
- Офісні застосунки
- Бази даних
- Біоінформатика
- Бізнес ІТ
- CAD/CAM
- Digital Lifestyle
- DTP
- Електроніка
- Цифрова фотографія
- Комп'ютерна графіка
- Ігри
- Хакування
- Hardware
- IT w ekonomii
- Наукові пакети
- Шкільні підручники
- Основи комп'ютера
- Програмування
- Мобільне програмування
- Інтернет-сервери
- Комп'ютерні мережі
- Стартап
- Операційні системи
- Штучний інтелект
- Технологія для дітей
- Вебмайстерність
-
Інше
-
Іноземні мови
-
Культура та мистецтво
-
Шкільні читанки
-
Література
- Антології
- Балада
- Біографії та автобіографії
- Для дорослих
- Драми
- Журнали, щоденники, листи
- Епос, епопея
- Нарис
- Наукова фантастика та фантастика
- Фельєтони
- Художня література
- Гумор, сатира
- Інше
- Класичний
- Кримінальний роман
- Нехудожня література
- Художня література
- Mity i legendy
- Лауреати Нобелівської премії
- Новели
- Побутовий роман
- Okultyzm i magia
- Оповідання
- Спогади
- Подорожі
- Оповідна поезія
- Поезія
- Політика
- Науково-популярна
- Роман
- Історичний роман
- Проза
- Пригодницька
- Журналістика
- Роман-репортаж
- Romans i literatura obyczajowa
- Сенсація
- Трилер, жах
- Інтерв'ю та спогади
-
Природничі науки
-
Соціальні науки
-
Шкільні підручники
-
Науково-популярна та академічна
- Археологія
- Bibliotekoznawstwo
- Кінознавство / Теорія кіно
- Філологія
- Польська філологія
- Філософія
- Finanse i bankowość
- Географія
- Економіка
- Торгівля. Світова економіка
- Історія та археологія
- Історія мистецтва і архітектури
- Культурологія
- Мовознавство
- літературні студії
- Логістика
- Математика
- Ліки
- Гуманітарні науки
- Педагогіка
- Навчальні засоби
- Науково-популярна
- Інше
- Психологія
- Соціологія
- Театральні студії
- Богослов’я
- Економічні теорії та науки
- Transport i spedycja
- Фізичне виховання
- Zarządzanie i marketing
-
Порадники
-
Ігрові посібники
-
Професійні та спеціальні порадники
-
Юридична
- Безпека життєдіяльності
- Історія
- Дорожній кодекс. Водійські права
- Юридичні науки
- Охорона здоров'я
- Загальне, компендіум
- Академічні підручники
- Інше
- Закон про будівництво і житло
- Цивільне право
- Фінансове право
- Господарське право
- Господарське та комерційне право
- Кримінальний закон
- Кримінальне право. Кримінальні злочини. Кримінологія
- Міжнародне право
- Міжнародне та іноземне право
- Закон про охорону здоров'я
- Закон про освіту
- Податкове право
- Трудове право та законодавство про соціальне забезпечення
- Громадське, конституційне та адміністративне право
- Кодекс про шлюб і сім'ю
- Аграрне право
- Соціальне право, трудове право
- Законодавство Євросоюзу
- Промисловість
- Сільське господарство та захист навколишнього середовища
- Словники та енциклопедії
- Державні закупівлі
- Управління
-
Путівники та подорожі
- Африка
- Альбоми
- Південна Америка
- Центральна та Північна Америка
- Австралія, Нова Зеландія, Океанія
- Австрія
- Азії
- Балкани
- Близький Схід
- Болгарія
- Китай
- Хорватія
- Чеська Республіка
- Данія
- Єгипет
- Естонія
- Європа
- Франція
- Гори
- Греція
- Іспанія
- Нідерланди
- Ісландія
- Литва
- Латвія
- Mapy, Plany miast, Atlasy
- Мініпутівники
- Німеччина
- Норвегія
- Активні подорожі
- Польща
- Португалія
- Інше
- Przewodniki po hotelach i restauracjach
- Росія
- Румунія
- Словаччина
- Словенія
- Швейцарія
- Швеція
- Світ
- Туреччина
- Україна
- Угорщина
- Велика Британія
- Італія
-
Психологія
- Філософія життя
- Kompetencje psychospołeczne
- Міжособистісне спілкування
- Mindfulness
- Загальне
- Переконання та НЛП
- Академічна психологія
- Психологія душі та розуму
- Психологія праці
- Relacje i związki
- Батьківство та дитяча психологія
- Вирішення проблем
- Інтелектуальний розвиток
- Секрет
- Сексуальність
- Спокушання
- Зовнішній вигляд та імідж
- Філософія життя
-
Релігія
-
Спорт, фітнес, дієти
-
Техніка і механіка
Аудіокниги
-
Бізнес та економіка
- Біткойн
- Ділова жінка
- Коучинг
- Контроль
- Електронний бізнес
- Економіка
- Фінанси
- Фондова біржа та інвестиції
- Особисті компетенції
- Комунікація та переговори
- Малий бізнес
- Маркетинг
- Мотивація
- Нерухомість
- Переконання та НЛП
- Податки
- Соціальна політика
- Порадники
- Презентації
- Лідерство
- Зв'язки з громадськістю
- Секрет
- Соціальні засоби комунікації
- Продаж
- Стартап
- Ваша кар'єра
- Управління
- Управління проектами
- Людські ресурси (HR)
-
Для дітей
-
Для молоді
-
Освіта
-
Енциклопедії, словники
-
Електронна преса
-
Історія
-
Інформатика
-
Інше
-
Іноземні мови
-
Культура та мистецтво
-
Шкільні читанки
-
Література
- Антології
- Балада
- Біографії та автобіографії
- Для дорослих
- Драми
- Журнали, щоденники, листи
- Епос, епопея
- Нарис
- Наукова фантастика та фантастика
- Фельєтони
- Художня література
- Гумор, сатира
- Інше
- Класичний
- Кримінальний роман
- Нехудожня література
- Художня література
- Mity i legendy
- Лауреати Нобелівської премії
- Новели
- Побутовий роман
- Okultyzm i magia
- Оповідання
- Спогади
- Подорожі
- Поезія
- Політика
- Науково-популярна
- Роман
- Історичний роман
- Проза
- Пригодницька
- Журналістика
- Роман-репортаж
- Romans i literatura obyczajowa
- Сенсація
- Трилер, жах
- Інтерв'ю та спогади
-
Природничі науки
-
Соціальні науки
-
Науково-популярна та академічна
-
Порадники
-
Професійні та спеціальні порадники
-
Юридична
-
Путівники та подорожі
-
Психологія
- Філософія життя
- Міжособистісне спілкування
- Mindfulness
- Загальне
- Переконання та НЛП
- Академічна психологія
- Психологія душі та розуму
- Психологія праці
- Relacje i związki
- Батьківство та дитяча психологія
- Вирішення проблем
- Інтелектуальний розвиток
- Секрет
- Сексуальність
- Спокушання
- Зовнішній вигляд та імідж
- Філософія життя
-
Релігія
-
Спорт, фітнес, дієти
-
Техніка і механіка
Відеокурси
-
Бази даних
-
Big Data
-
Biznes, ekonomia i marketing
-
Кібербезпека
-
Data Science
-
DevOps
-
Для дітей
-
Електроніка
-
Графіка / Відео / CAX
-
Ігри
-
Microsoft Office
-
Інструменти розробки
-
Програмування
-
Особистісний розвиток
-
Комп'ютерні мережі
-
Операційні системи
-
Тестування програмного забезпечення
-
Мобільні пристрої
-
UX/UI
-
Веброзробка, Web development
-
Управління
Подкасти
Інше
Skazany na sukces. Kariera w Data Science
Jacqueline Nolis, Emily Robinson
Nauka o danych, zwana danologią, zyskuje na znaczeniu. Dane dla gospodarki są tym, czym dotąd były węgiel, stal i ropa naftowa. Umiejętność korzystania z wiedzy zawartej w danych decyduje o efektywności prowadzenia działalności gospodarczej i determinuje rozwój nowych modeli, rozwiązań i relacji gospodarczych. Już teraz specjaliści danolodzy są rozchwytywani na rynku pracy. Aby jednak w pełni i do końca wykorzystać pojawiające się możliwości, trzeba wiedzieć, w jaki sposób podejść do trudnego zagadnienia, jakim jest budowanie ścieżki kariery i podążanie nią w odpowiednim dla siebie tempie. To praktyczny przewodnik, dzięki któremu łatwiej zdobędziesz pierwszą pracę związaną z badaniem danych, szybciej staniesz się cenionym specjalistą i w miarę rozwoju zawodowego będziesz coraz trafniej wychwytywać pojawiające się możliwości awansu i zmiany pracy na atrakcyjniejszą. Dowiesz się, jak zdobyć podstawowe umiejętności i jak faktycznie wyglądają konkretne stanowiska pracy. Opisano tu również, jak pomyślnie przejść przez proces rekrutacji i zaaklimatyzować się w nowych warunkach. Nie zabrakło cennych wskazówek dotyczących awansowania na stanowiska kierownicze. Jako danolog prędko się przekonasz, że zawarta tutaj wiedza nietechniczna jest bardzo potrzebna do osiągnięcia sukcesu na polu badania danych. Dzięki tej książce dowiesz się, jak: tworzyć świetne portfolio projektów z zakresu badania danych wyszukiwać, oceniać i negocjować oferty z klasą zmieniać miejsca pracy wybierać i skutecznie realizować scenariusze kariery poradzili sobie inni wybitni analitycy danych! Danologia: nauka, pasja i sposób na życie!
With an increasing number of devices getting connected to the Internet, massive amounts of data are being generated that can be used for analysis. This book helps you to understand Internet of Things in depth and decision science, and solve business use cases. With IoT, the frequency and impact of the problem is huge. Addressing a problem with such a huge impact requires a very structured approach. The entire journey of addressing the problem by defining it, designing the solution, and executing it using decision science is articulated in this book through engaging and easy-to-understand business use cases. You will get a detailed understanding of IoT, decision science, and the art of solving a business problem in IoT through decision science. By the end of this book, you’ll have an understanding of the complex aspects of decision making in IoT and will be able to take that knowledge with you onto whatever project calls for it
Spark. Błyskawiczna analiza danych. Wydanie II
Jules S. Damji, Brooke Wenig, Tathagata Das, Denny Lee
Apache Spark jest oprogramowaniem open source, przeznaczonym do klastrowego przetwarzania danych dostarczanych w różnych formatach. Pozwala na uzyskanie niespotykanej wydajności, umożliwia też pracę w trybie wsadowym i strumieniowym. Framework ten jest również świetnie przygotowany do uruchamiania złożonych aplikacji, włączając w to algorytmy uczenia maszynowego czy analizy predykcyjnej. To wszystko sprawia, że Apache Spark stanowi znakomity wybór dla programistów zajmujących się big data, a także eksploracją i analizą danych. To książka przeznaczona dla inżynierów danych i programistów, którzy chcą za pomocą Sparka przeprowadzać skomplikowane analizy danych i korzystać z algorytmów uczenia maszynowego, nawet jeśli te dane pochodzą z różnych źródeł. Wyjaśniono tu, jak dzięki Apache Spark można odczytywać i ujednolicać duże zbiory informacji, aby powstawały niezawodne jeziora danych, w jaki sposób wykonuje się interaktywne zapytania SQL, a także jak tworzy się potoki przy użyciu MLlib i wdraża modele za pomocą biblioteki MLflow. Omówiono również współdziałanie aplikacji Sparka z jego rozproszonymi komponentami i tryby jej wdrażania w poszczególnych środowiskach. W książce: API strukturalne dla Pythona, SQL, Scali i Javy operacje Sparka i silnika SQL konfiguracje Sparka i interfejs Spark UI nawiązywanie połączeń ze źródłami danych: JSON, Parquet, CSV, Avro, ORC, Hive, S3 i Kafka operacje analityczne na danych wsadowych i strumieniowanych niezawodne potoki danych i potoki uczenia maszynowego Spark: twórz skalowalne i niezawodne aplikacje big data!
Spark. Zaawansowana analiza danych
Uri Laserson, Sandy Ryza, Sean Owen, Josh Wills
Analiza ogromnych zbiorów danych nie musi być wolna! Apache Spark to darmowy, zaawansowany szkielet i silnik pozwalający na szybkie przetwarzanie oraz analizę ogromnych zbiorów danych. Prace nad tym projektem rozpoczęły się w 2009 roku, a już rok później Spark został udostępniony użytkownikom. Jeżeli potrzebujesz najwyższej wydajności w przetwarzaniu informacji, jeżeli chcesz uzyskiwać odpowiedź na trudne pytania niemalże w czasie rzeczywistym, Spark może być odpowiedzią na Twoje oczekiwania. Sięgnij po tę książkę i przekonaj się, czy tak jest w rzeczywistości. Autor porusza tu zaawansowane kwestie związane z analizą statystyczną danych, wykrywaniem anomalii oraz analizą obrazów. Jednak zanim przejdziesz do tych tematów, zapoznasz się z podstawami — wprowadzeniem do analizy danych za pomocą języka Scala oraz Apache Spark. Nauczysz się też przeprowadzać analizę semantyczną i zobaczysz, jak w praktyce przeprowadzić analizę sieci współwystępowań za pomocą biblioteki GraphX. Na koniec dowiesz się, jak przetwarzać dane geoprzestrzenne i genomiczne, a także oszacujesz ryzyko metodą symulacji Monte Carlo. Książka ta pozwoli Ci na wykorzystanie potencjału Apache Spark i zaprzęgnięcie go do najtrudniejszych zadań! Przykłady prezetnowane w książce obejmują: Rekomendowanie muzyki i dane Audioscrobbler Prognozowanie zalesienia za pomocą drzewa decyzyjnego Wykrywanie anomalii w ruchu sieciowym metodą grupowania według k-średnich Wikipedia i ukryta analiza semantyczna Analiza sieci współwystępowań za pomocą biblioteki GraphX Geoprzestrzenna i temporalna analiza tras nowojorskich taksówek Szacowanie ryzyka finansowego metodą symulacji Monte Carlo Analiza danych genomicznych i projekt BDG Analiza danych neuroobrazowych za pomocą pakietów PySpark i Thunder Poznaj potencjał i wydajność Apache Spark!
Splunk Best Practices. Operational intelligent made simpler
This book will give you an edge over others through insights that will help you in day-to-day instances. When you're working with data from various sources in Splunk and performing analysis on this data, it can be a bit tricky. With this book, you will learn the best practices of working with Splunk.You'll learn about tools and techniques that will ease your life with Splunk, and will ultimately save you time. In some cases, it will adjust your thinking of what Splunk is, and what it can and cannot do.To start with, you'll get to know the best practices to get data into Splunk, analyze data, and package apps for distribution. Next, you'll discover the best practices in logging, operations, knowledge management, searching, and reporting. To finish off, we will teach you how to troubleshoot Splunk searches, as well as deployment, testing, and development with Splunk.
Splunk: Enterprise Operational Intelligence Delivered. Machine data made accessible
Derek Mock, Betsy Page Sigman, Paul R. Johnson, Erickson Delgado, ...
Splunk is an extremely powerful tool for searching, exploring, and visualizing data of all types. Splunk is becoming increasingly popular, as more and more businesses, both large and small, discover its ease and usefulness. Analysts, managers, students, and others can quickly learn how to use the data from their systems, networks, web traffic, and social media to make attractive and informative reports. This course will teach everything right from installing and configuring Splunk.The first module is for anyone who wants to manage data with Splunk. You’ll start with very basics of Splunk— installing Splunk— before then moving on to searching machine data with Splunk. You will gather data from different sources, isolate them by indexes, classify them into source types, and tag them with the essential fields.With more than 70 recipes on hand in the second module that demonstrate all of Splunk’s features, not only will you find quick solutions to common problems, but you’ll also learn a wide range of strategies and uncover new ideas that will make you rethink what operational intelligence means to you and your organization.Dive deep into Splunk to find the most efficient solution to your data problems in the third module. Create the robust Splunk solutions you need to make informed decisions in big data machine analytics. From visualizations to enterprise integration, this well-organized high level guide has everything you need for Splunk mastery.This learning path combines some of the best that Packt has to offer into one complete, curated package. It includes content from the following Packt products:• Splunk Essentials - Second Edition• Splunk Operational Intelligence Cookbook - Second Edition• Advanced Splunk
Josh Diakun, Derek Mock, Paul R. Johnson
Splunk makes it easy for you to take control of your data, and with Splunk Operational Cookbook, you can be confident that you are taking advantage of the Big Data revolution and driving your business with the cutting edge of operational intelligence and business analytics. With more than 70 recipes that demonstrate all of Splunk’s features, not only will you find quick solutions to common problems, but you’ll also learn a wide range of strategies and uncover new ideas that will make you rethink what operational intelligence means to you and your organization.You’ll discover recipes on data processing, searching and reporting, dashboards, and visualizations to make data shareable, communicable, and most importantly meaningful. You’ll also find step-by-step demonstrations that walk you through building an operational intelligence application containing vital features essential to understanding data and to help you successfully integrate a data-driven way of thinking in your organization.Throughout the book, you’ll dive deeper into Splunk, explore data models and pivots to extend your intelligence capabilities, and perform advanced searching to explore your data in even more sophisticated ways. Splunk is changing the business landscape, so make sure you’re taking advantage of it.
SQL for Data Analytics. Harness the power of SQL to extract insights from data - Third Edition
Jun Shan, Matt Goldwasser, Upom Malik, Benjamin Johnston
Every day, businesses operate around the clock, and a huge amount of data is generated at a rapid pace. This book helps you analyze this data and identify key patterns and behaviors that can help you and your business understand your customers at a deep, fundamental level.SQL for Data Analytics, Third Edition is a great way to get started with data analysis, showing how to effectively sort and process information from raw data, even without any prior experience.You will begin by learning how to form hypotheses and generate descriptive statistics that can provide key insights into your existing data. As you progress, you will learn how to write SQL queries to aggregate, calculate, and combine SQL data from sources outside of your current dataset. You will also discover how to work with advanced data types, like JSON. By exploring advanced techniques, such as geospatial analysis and text analysis, you will be able to understand your business at a deeper level. Finally, the book lets you in on the secret to getting information faster and more effectively by using advanced techniques like profiling and automation. By the end of this book, you will be proficient in the efficient application of SQL techniques in everyday business scenarios and looking at data with the critical eye of analytics professional.
SQL Pocket Primer. A Comprehensive Guide to SQL and MySQL for Data Professionals
Mercury Learning and Information, Oswald Campesato
As part of the best-selling Pocket Primer series, this book is designed for data scientists and machine learning engineers seeking to deepen their SQL knowledge using MySQL as the primary RDBMS. It features Python-based code samples for accessing data from MySQL tables in Pandas data frames and Java-based samples for data access in MySQL, along with handling XML and JSON documents.The book also introduces NoSQL, with an overview of MongoDB, and SQLite, an open-source RDBMS for mobile devices. The final section covers diverse topics like normalization, schemas, database optimization, and performance. This comprehensive approach ensures a well-rounded understanding of SQL and related technologies, enhancing data manipulation and database management skills.Numerous code samples and listings throughout the book support the various topics covered. Companion files with source code and figures are available from the publisher, making this an essential resource for advancing your SQL proficiency and database management expertise.
Steve Hughes, Dennis Neer, Dr. Ram Babu Singh, Shabbir H. Mala, ...
SQL has been the de facto standard when interacting with databases for decades and shows no signs of going away. Through the years, report developers or data wranglers have had to learn SQL on the fly to meet the business needs, so if you are someone who needs to write queries, SQL Query Design and Pattern Best Practices is for you.This book will guide you through making efficient SQL queries by reducing set sizes for effective results. You’ll learn how to format your results to make them easier to consume at their destination. From there, the book will take you through solving complex business problems using more advanced techniques, such as common table expressions and window functions, and advance to uncovering issues resulting from security in the underlying dataset. Armed with this knowledge, you’ll have a foundation for building queries and be ready to shift focus to using tools, such as query plans and indexes, to optimize those queries. The book will go over the modern data estate, which includes data lakes and JSON data, and wrap up with a brief on how to use Jupyter notebooks in your SQL journey.By the end of this SQL book, you’ll be able to make efficient SQL queries that will improve your report writing and the overall SQL experience.
Dinesh Priyankara, Robert Cain
Microsoft SQL Server 2016 Reporting Services comes with many new features. It offers different types of reporting such as Production, Ad-hoc, Dashboard, Mash-up, and Analytical. SQL Server 2016 also has a surfeit of new features including Mobile Reporting, and Power BI integration.This book contains recipes that explore the new and advanced features added to SQL Server 2016. The first few chapters cover recipes on configuring components and how to explore these new features. You’ll learn to build your own reporting solution with data tools and report builder, along with learning techniques to create visually appealing reports. This book also has recipes for enhanced mobile reporting solutions, accessing these solutions effectively, and delivering interactive business intelligence solutions. Towards the end of the book, you’ll get to grips with running reporting services in SharePoint integrated mode and be able to administer, monitor, and secure your reporting solution. This book covers about the new offerings of Microsoft SQL Server 2016 Reporting Services in comprehensive detail and uses examples of real-world problem-solving business scenarios.
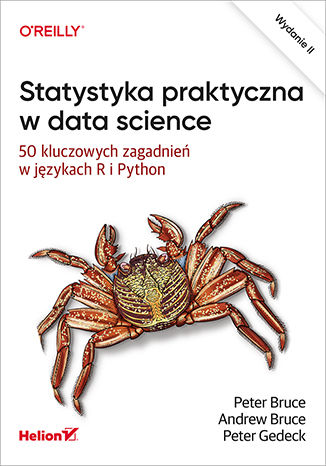
Statystyka praktyczna w data science. 50 kluczowych zagadnień w językach R i Python. Wydanie II
Peter Bruce, Andrew Bruce, Peter Gedeck
Metody statystyczne są kluczowym narzędziem w data science, mimo to niewielu analityków danych zdobyło wykształcenie w ich zakresie. Może im to utrudniać uzyskiwanie dobrych efektów. Zrozumienie praktycznych zasad statystyki okazuje się ważne również dla programistów R i Pythona, którzy tworzą rozwiązania dla data science. Kursy podstaw statystyki rzadko jednak uwzględniają tę perspektywę, a większość podręczników do statystyki w ogóle nie zajmuje się narzędziami wywodzącymi się z informatyki. To drugie wydanie popularnego podręcznika statystyki przeznaczonego dla analityków danych. Uzupełniono je o obszerne przykłady w Pythonie oraz wyjaśnienie, jak stosować poszczególne metody statystyczne w problemach data science, a także jak ich nie używać. Skoncentrowano się też na tych zagadnieniach statystyki, które odgrywają istotną rolę w data science. Wyjaśniono, które koncepcje są ważne i przydatne z tej perspektywy, a które mniej istotne i dlaczego. Co ważne, poszczególne koncepcje i zagadnienia praktyczne przedstawiono w sposób przyswajalny i zrozumiały również dla osób nienawykłych do posługiwania się statystyką na co dzień. W książce między innymi: analiza eksploracyjna we wstępnym badaniu danych próby losowe a jakość dużych zbiorów danych podstawy planowania eksperymentów regresja w szacowaniu wyników i wykrywaniu anomalii statystyczne uczenie maszynowe uczenie nienadzorowane a znaczenie danych niesklasyfikowanych Statystyka: klasyczne narzędzia w najnowszych technologiach!
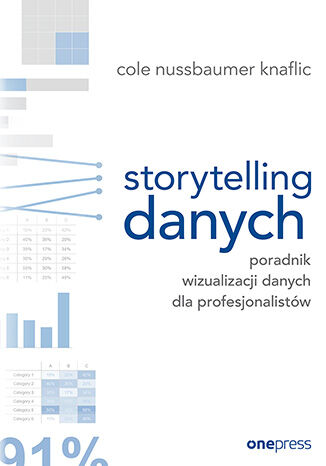
Storytelling danych. Poradnik wizualizacji danych dla profesjonalistów
Rozwój technologiczny nie tylko zwiększył ilość i dostępność danych, ale również zaowocował wszechobecnością narzędzi do ich obróbki i prezentacji. W zasadzie każdy może tworzyć diagramy i prezentacje. Aby przykuć uwagę odbiorcy i przekazać mu informację zawartą w zbiorze danych, sama wiedza techniczna nie wystarczy. Problem wynika z tego, że większość ludzi nie ma naturalnej umiejętności przekładania danych na interesujące historie. Tego się po prostu trzeba nauczyć. Dopiero wtedy można mówić o skutecznym przekazie. Ta książka jest przewodnikiem dla każdego, kto musi przekazywać informacje, robiąc przy tym użytek z danych. Szczególnie wartościowa będzie dla analityków, studentów i naukowców, a także dla każdego, kto w swojej komunikacji odwołuje się do danych. Pokazano tu prostą i intuicyjną technikę przedstawiania historii przy użyciu danych w sześciu krokach („lekcjach”). Skuteczność tej metody potwierdzono wieloma przykładami zaczerpniętymi z przeróżnych branż. Poszczególne procesy zaprezentowano za pomocą instrukcji „krok po kroku”, opisano także tok rozumowania podczas realizacji projektu graficznej wizualizacji danych. Przy tym wszystkim zawarte w książce praktyczne wskazówki są gotowe do natychmiastowego zastosowania. Sześć kluczowych lekcji skutecznej komunikacji wizualnej: Zrozumienie kontekstu. Wybór odpowiedniego wykresu. Eliminacja śmieci. Kierowanie uwagą odbiorców. Myślenie niczym projektant. Przedstawianie historii. Dane nadają sens prezentacji!
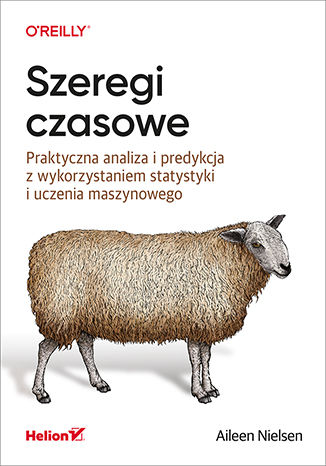
Szeregi czasowe. Praktyczna analiza i predykcja z wykorzystaniem statystyki i uczenia maszynowego
Analiza szeregów czasowych zyskuje na znaczeniu. Wraz z postępującą digitalizacją danych służby zdrowia, rozwojem inteligentnych miast czy upowszechniającym się internetem rzeczy staje się coraz bardziej potrzebna. Obiecującym rozwiązaniem jest analiza szeregów czasowych metodami wspomaganymi uczeniem maszynowym. Techniki te umożliwiają skuteczne monitorowanie i wykorzystywanie coraz większych zbiorów danych. Być może ich zastosowanie do pracy z szeregami czasowymi wydaje się nieoczywiste, jednak bez analiz szeregów czasowych nie można w pełni wykorzystać zebranych danych. Ta książka jest szerokim, aktualnym i praktycznym przeglądem metod analizy szeregów czasowych, w którym ujęto pełny potok przetwarzania danych czasowych i modelowania. Zaprezentowano w niej rzeczywiste przypadki użycia tych metod i zilustrowano je obszernymi fragmentami znakomicie zaprojektowanego kodu w językach R i Python. Znalazły się tutaj praktyczne wskazówki ułatwiające rozwiązywanie najczęstszych problemów występujących w inżynierii danych czasowych i ich analizie. Ujęto tu zarówno konwencjonalne metody statystyczne, jak i nowoczesne techniki uczenia maszynowego. To bardzo przydatny przewodnik, dzięki któremu analitycy danych, inżynierowie oprogramowania i naukowcy będą mogli płynnie przejść od podstaw pracy z szeregami czasowymi do rozwiązywania konkretnych zagadnień na profesjonalnym poziomie. Dzięki tej książce nauczysz się: pozyskiwać, przechowywać i przetwarzać szeregi czasowe eksplorować dane czasowe i symulować je wykonywać pomiary błędów pracować z szeregami czasowymi za pomocą uczenia maszynowego lub uczenia głębokiego oceniać dokładność i wydajność modeli Skutecznie analizuj szeregi czasowe i wydobywaj bezcenną wiedzę!
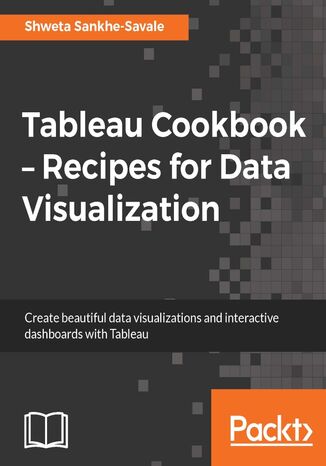
Tableau Cookbook - Recipes for Data Visualization. Click here to enter text
Data is everywhere and everything is data! Visualization of data allows us to bring out the underlying trends and patterns inherent in the data and gain insights that enable faster and smarter decision making. Tableau is one of the fastest growing and industry leading Business Intelligence platforms that empowers business users to easily visualize their data and discover insights at the speed of thought. Tableau is a self-service BI platform designed to make data visualization and analysis as intuitive as possible. Creating visualizations with simple drag-and-drop, you can be up and running on Tableau in no time.Starting from the fundamentals such as getting familiarized with Tableau Desktop, connecting to common data sources and building standard charts; you will walk through the nitty gritty of Tableau such as creating dynamic analytics with parameters, blended data sources, and advanced calculations. You will also learn to group members into higher levels, sort the data in a specific order & filter out the unnecessary information. You will then create calculations in Tableau & understand the flexibility & power they have and go on to building story-boards and share your insights with others.Whether you are just getting started or whether you need a quick reference on a “how-to” question, This book is the perfect companion for you

